Daily Review for June 14, 2022
A significant drop in the stock market was evidenced yesterday, due to the high level of inflation in the United States. The Dow Jones fell 876 points, the S&P500 fell 151 points and the Nasdaq 100 fell 530 points.
Traders are looking ahead to OPEC’s monthly report, which includes demand and supply projections, at a time when the market continues to be highly volatile.
Bitcoin fell to new support at USD$20,754, the lowest level in recent years. The US Treasury Secretary said “There are many risks associated with cryptocurrencies”.
Traders are keeping an eye on macroeconomic data in the Euro Zone. At the moment inflation in Germany is reported at 7.9% y/y, which is above the inflation target of 2% y/y.
| GOLD -0.10% |
| A significant drop in the stock market was evidenced yesterday, due to the high level of inflation in the United States. The Dow Jones fell 876 points, the S&P500 fell 151 points and the Nasdaq 100 fell 530 points. Analysts expect the Fed to raise interest rates at tomorrow’s meeting by 75 basis points. This would lead to a further correction in the market. As a result, traders have started to buy back gold and silver. Gold is currently down 0.10% and is trading at USD$1,829 per Troy ounce. |
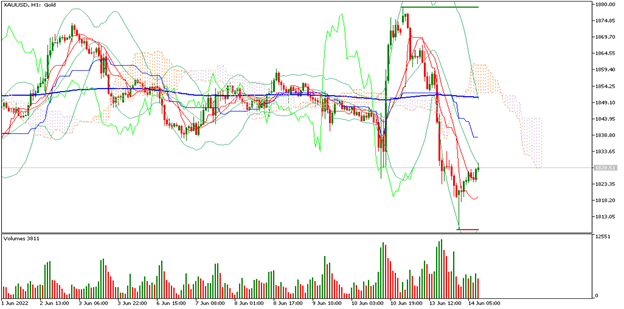 |
| Support 1: 1826.54 Support 2: 1823.57 Support 3: 1821.94 Resistance 1: 1831.14 Resistance 2: 1832.77 Resistance 3: 1835.74 Pivot Point: 1828.17 |
| The price is below the 200-day moving average, between resistance 2 and support 2. Expected trading range between USD$1,821 and USD$1,835. Pivot point for trend change at USD$1,828. RSI neutral, so the price of gold could remain sideways with an uptrend. |
| WTI +0.66% |
| Traders are paying close attention to OPEC’s monthly report, which includes demand and supply projections, at a time when the market continues to be highly volatile. At the moment, WTI is up 0.66% and is trading at USD$121.78 per barrel. According to the EIA, the Oil & Gas companies listed on the stock exchange, presented less investments in exploration in 2021. On the other hand, Germany could spend USD$10 billion to recover the Gazprom operation that was expropriated in the country. |
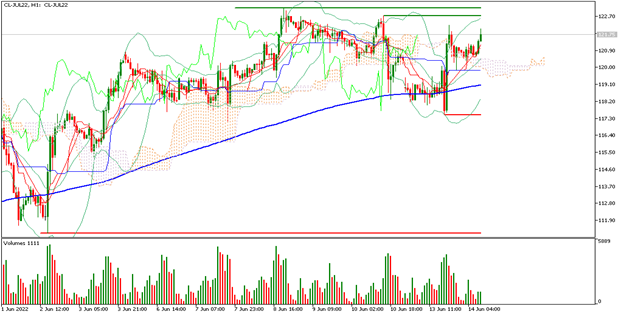 |
| Support 1: 120.91 Support 2: 120.44 Support 3: 120.16 Resistance 1: 121.66 Resistance 2: 121.94 Resistance 3: 122.41 Pivot Point: 121.19 |
| The price is above the 200-day moving average, between support 1 and resistance 1. Expected trading range between USD$120.16 and USD$122.41. Pivot point for trend change at USD$121.19. RSI neutral, so the price could continue the uptrend towards the next resistance levels. |
| BITCOIN -10.52% |
| Bitcoin fell to new support at USD$20,754, the lowest level in recent years. The U.S. Treasury Secretary said “There are many risks associated with cryptocurrencies” so we can expect a possible intervention of governments to protect investments in this asset class. Bitcoin is currently down 10.52% and is trading at USD$22,598. The world’s largest exchange Binance stopped Bitcoin withdrawals, so crypto brokers are reviewing liquidity levels. |
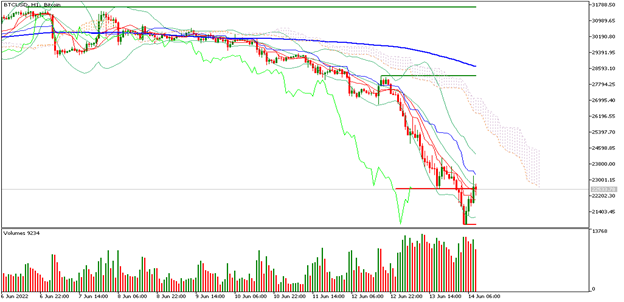 |
| Support 1: 22035.4 Support 2: 21288.7 Support 3: 20643.4 Resistance 1: 23427.4 Resistance 2: 24072.7 Resistance 3: 24819.4 Pivot Point: 22680.7 |
| The price is below the 200-day moving average which is a bearish signal in Bitcoin. The price is between resistance 1 and support 2. Expected trading range between USD$20,643 and USD$24,819. Pivot point for trend change at USD$22,680. RSI neutral, so the price continues with bearish pressure. |
| EUROSTOXX 50 -0.03% |
| Traders are keeping a close eye on macroeconomic data in the Euro Zone. At the moment, German inflation is reported at 7.9% y/y, which is above the 2% y/y inflation target. Today we will also have CPI reports in Germany and Portugal, the UK unemployment rate, Euro Zone industrial production and the ZEW index of investment confidence in Germany and the Euro Zone. There will also be statements from BUBA, Germany’s central bank. Traders continue to watch for the European Central Bank’s interest rate hike. |
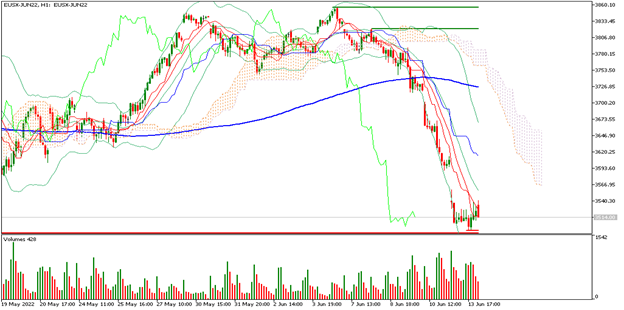 |
| Support 1: 3510 Support 2: 3503 Support 3: 3492 Resistance 1: 3528 Resistance 2: 3539 Resistance 3: 3546 Pivot Point: 3521 |
| Price is below the 200-day moving average, between support 2 and resistance 1. Expected trading range between 3,492 and 3,546. Pivot point for trend change at 3,521. RSI in oversold zone, so the index could change trend and recover part of yesterday’s fall. |
| Sources |
| Reuters Market watch Bloomberg Capitalix Market Research |
ข้อจำกัดความรับผิดชอบ
ข้อมูล/บทความ/เอกสาร/เนื้อหาใดๆ ที่ Capitalix จัดหาให้ หรือแสดงบนเว็บไซต์นั้นมีจุดประสงค์เพื่อใช้ในการศึกษาเท่านั้น และไม่ใช่คำแนะนำในการลงทุนหรือการให้คำปรึกษาว่าลูกค้าควรเทรดอย่างไรบ้าง
แม้ว่า Capitalix จะมั่นใจว่าข้อมูลดังกล่าวถูกต้อง แต่ก็จะไม่มีความรับผิดชอบต่อการละเลย/ข้อผิดพลาด/การคำนวณที่ผิดพลาด และไม่รับประกันความแม่นยำของเครื่องมือหรือข้อมูลใด ๆ ที่มีอยู่ในที่นี้
ดังนั้น ความเชื่อมั่นที่คุณให้กับเนื้อหาดังกล่าวถือเป็นความเสี่ยงของคุณเอง โปรดทราบว่าความรับผิดชอบในการใช้หรือพึ่งพาเครื่องมือดังกล่าวขึ้นอยู่กับลูกค้า และ Capitalix จะไม่รับผิดชอบต่อความสูญเสียหรือความเสียหายใดๆ ที่เกิดขึ้น ซึ่งรวมถึงการสูญเสียผลกำไรใดๆ ที่อาจเกิดขึ้นโดยตรง หรือโดยอ้อมจากการใช้ข้อมูลดังกล่าว
คำเตือนเกี่ยวกับความเสี่ยง: การซื้อขาย Forex/CFD มีความเสี่ยงต่อเงินลงทุนของคุณอย่างมาก โปรดอ่านและตรวจสอบข้อมูลให้แน่ใจว่าคุณเข้าใจนโยบายการเปิดเผยความเสี่ยงของเราอย่างครบถ้วน นโยบายการเปิดเผยความเสี่ยง.
คุณควรตรวจสอบให้แน่ใจว่า คุณได้รับอนุญาตให้ซื้อขายผลิตภัณฑ์กับ Capitalix.com ได้ ทั้งนี้ขึ้นอยู่กับประเทศที่คุณอาศัยอยู่ด้วย โปรดตรวจสอบให้แน่ใจว่าคุณพร้อมที่จะเผชิญกับนโยบายการเปิดเผยความเสี่ยงของบริษัทเรา