Daily Review for May 27, 2022
Investors are beginning to have doubts about Ethereum 2.0 update, and are starting to sell part of their holdings in the crypto.
Stock markets are mixed globally. Wall Street indices are in negative territory. The Nasdaq 100 is correcting 0.25% and is trading at 12,256 points.
Due to the volatility in equities at the end of the week, investors have returned to take positions in gold and silver.
Yesterday, the price of natural gas reached USD$9.42 per BTU. Meanwhile, the European Union and Asian importers are looking to close long-term LNG supply agreements.
| ETHEREUM -7.70% |
| Investors are beginning to have doubts about Ethereum 2.0 update, and are starting to sell part of their holdings in the crypto. Ethereum is currently down 7.70% and is trading at USD$1,772. Traders are looking ahead to the expiration of USD$1 billion in Ethereum options today. Bulls are still looking for USD$2,100 and USD$3,000 in the short term. On the other hand, bears are looking for USD$1,600 and USD$1,700. At the moment, the market is still under selling pressure. |
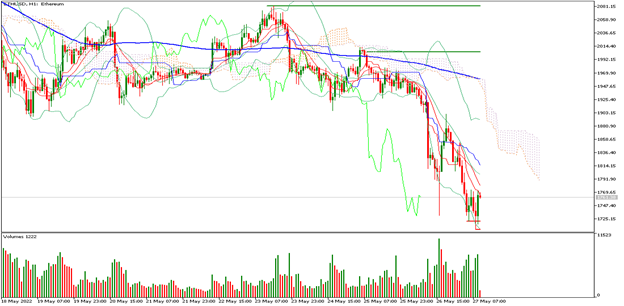 |
| Support 1: 1,736.71 Support 2: 1,704.54 Support 3: 1,685.49 Resistance 1: 1,787.93 Resistance 2: 1,806.98 Resistance 3: 1,839.15 Pivot Point: 1,755.76 |
| Price is below the 200-day moving average, between resistance 1 and support 1. Expected trading range between USD$1,685 and USD$1,839. Pivot point at USD$1,755. RSI neutral, so the correction could continue some additional points, to mark the inflection level for investors. |
| NASDAQ 100 -0.25% |
| Stock markets are mixed globally. Wall Street indices are in negative territory. The Nasdaq 100 is correcting 0.25% and is trading at 12,256 points. Traders are paying attention to the FOMC and ECB statements on monetary policy, and also to the expiration of options on cryptos, mainly Bitcoin and Ethereum. The correlation between the Nasdaq 100 and cryptos is high, so a correction in the price of cryptos is reflected in the index. |
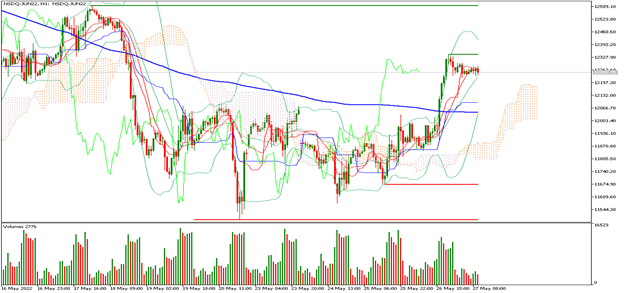 |
| Support 1: 12,243.9 Support 2: 12,218.3 Support 3: 12,204.2 Resistance 1: 12,283.6 Resistance 2: 12,297.7 Resistance 3: 12,323.3 Pivot Point: 12,258.0 |
| Price is above the 200-day moving average, between resistance 1 and support 1. Expected trading range between 12,204 and 12,323. Pivot point for trend change at 12,258. RSI is coming out of the overbought zone, so the index may correct some points. |
| GOLD +0.46% |
| Due to the volatility in equities at the close of the week, investors have once again taken positions in gold and silver. Gold prices are currently up 0.46% and are trading at USD$1,855 per Troy ounce. The expiration of Bitcoin and Ethereum options is also causing traders to buy the metals in order to mitigate portfolio volatility. Wall Street and European indices remain negative, so traders are looking to trade commodities. |
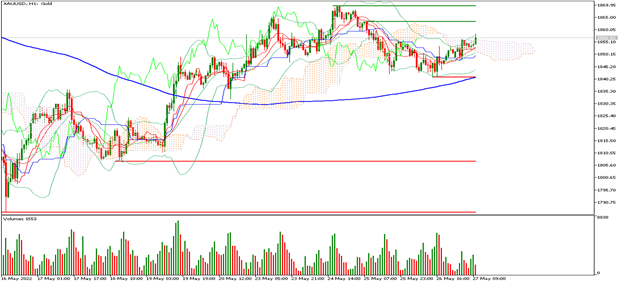 |
| Support 1: 1,850.75 Support 2: 1,848.56 Support 3: 1,846.72 Resistance 1: 1,854.78 Resistance 2: 1,856.62 Resistance 3: 1,858.81 Pivot Point: 1,852.59 |
| The price is above the 200-day moving average, between resistance 1 and support 1. Expected trading range between USD$1,846 and USD$1,858. Pivot point for trend change at USD$1,852. RSI neutral, so the price could climb towards USD$1,869. |
| NATURAL GAS -0.99% |
| Yesterday the price of natural gas reached USD$9.42 per BTU. Meanwhile, the European Union and Asian importers are seeking to close long-term LNG supply agreements. In Spain, an austerity plan for natural gas consumption has begun. The same is expected to happen in Europe, due to the increase in demand due to the summer and the shortage of the commodity as a result of the war in Ukraine. |
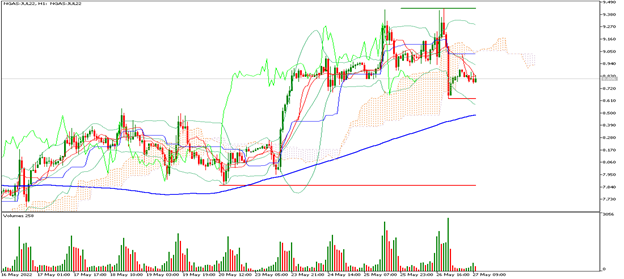 |
| Support 1: 8.741 Support 2: 8.703 Support 3: 8.642 Resistance 1: 8.840 Resistance 2: 8.901 Resistance 3: 8.939 Pivot Point: 8.802 |
| The price is above the 200-day moving average, between resistance 3 and support 1. Expected trading range between USD$8.64 and USD$8.93. Pivot point for trend change at USD$8.80. RSI neutral, so the price could correct towards USD$8.58. |
| Sources |
| Reuters Market watch Bloomberg Capitalix Market Research |
Divulgation des risques
Toute information/article/matériel/contenu fourni par Capitalix ou affiché sur leur site web est destiné à être utilisé à des fins éducatives uniquement et ne constitue pas un conseil d’investissement ou une consultation sur la façon dont le client devrait faire du trading.
Bien que Capitalix ait veillé à l’exactitude du contenu de ces informations, elle n’est pas responsable de toute omission/erreur/malentendu et ne peut garantir l’exactitude de tout matériel ou de toute information contenue dans ce document.
Par conséquent, toute confiance que vous accordez à ce matériel est strictement à vos propres risques. Veuillez noter que la responsabilité de l’utilisation ou de la fiabilité de ce matériel incombe au client et que Capitalix n’accepte aucune responsabilité pour toute perte ou tout dommage, y compris, sans s’y limiter, toute perte de profit pouvant découler directement ou indirectement de l’utilisation ou de la fiabilité de ces informations.
Avertissement de risque: Le trading de Forex/CFDs implique un risque conséquent pour votre capital. Veuillez lire et vous assurer que vous comprenez parfaitement notre Politique de claude de non-responsabilité.
Vous devez vous assurer que, selon votre pays de résidence, vous êtes autorisé à trader les produits de Capitalix.com. Veuillez vous assurer que vous êtes familier avec la divulgation des risques de l’entreprise.