Daily Review for May 27, 2022
Investors are beginning to have doubts about Ethereum 2.0 update, and are starting to sell part of their holdings in the crypto.
Stock markets are mixed globally. Wall Street indices are in negative territory. The Nasdaq 100 is correcting 0.25% and is trading at 12,256 points.
Due to the volatility in equities at the end of the week, investors have returned to take positions in gold and silver.
Yesterday, the price of natural gas reached USD$9.42 per BTU. Meanwhile, the European Union and Asian importers are looking to close long-term LNG supply agreements.
| ETHEREUM -7.70% |
| Investors are beginning to have doubts about Ethereum 2.0 update, and are starting to sell part of their holdings in the crypto. Ethereum is currently down 7.70% and is trading at USD$1,772. Traders are looking ahead to the expiration of USD$1 billion in Ethereum options today. Bulls are still looking for USD$2,100 and USD$3,000 in the short term. On the other hand, bears are looking for USD$1,600 and USD$1,700. At the moment, the market is still under selling pressure. |
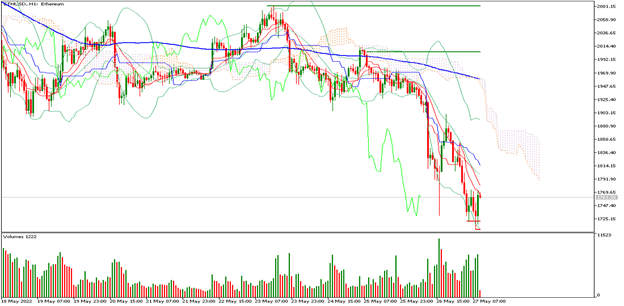 |
| Support 1: 1,736.71 Support 2: 1,704.54 Support 3: 1,685.49 Resistance 1: 1,787.93 Resistance 2: 1,806.98 Resistance 3: 1,839.15 Pivot Point: 1,755.76 |
| Price is below the 200-day moving average, between resistance 1 and support 1. Expected trading range between USD$1,685 and USD$1,839. Pivot point at USD$1,755. RSI neutral, so the correction could continue some additional points, to mark the inflection level for investors. |
| NASDAQ 100 -0.25% |
| Stock markets are mixed globally. Wall Street indices are in negative territory. The Nasdaq 100 is correcting 0.25% and is trading at 12,256 points. Traders are paying attention to the FOMC and ECB statements on monetary policy, and also to the expiration of options on cryptos, mainly Bitcoin and Ethereum. The correlation between the Nasdaq 100 and cryptos is high, so a correction in the price of cryptos is reflected in the index. |
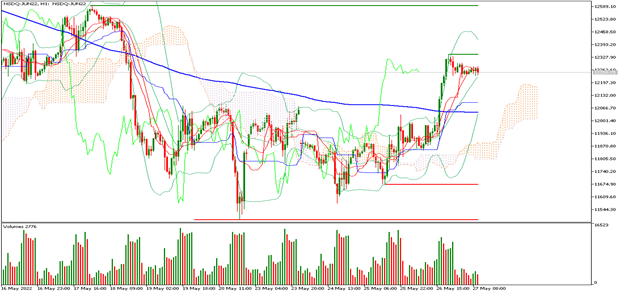 |
| Support 1: 12,243.9 Support 2: 12,218.3 Support 3: 12,204.2 Resistance 1: 12,283.6 Resistance 2: 12,297.7 Resistance 3: 12,323.3 Pivot Point: 12,258.0 |
| Price is above the 200-day moving average, between resistance 1 and support 1. Expected trading range between 12,204 and 12,323. Pivot point for trend change at 12,258. RSI is coming out of the overbought zone, so the index may correct some points. |
| GOLD +0.46% |
| Due to the volatility in equities at the close of the week, investors have once again taken positions in gold and silver. Gold prices are currently up 0.46% and are trading at USD$1,855 per Troy ounce. The expiration of Bitcoin and Ethereum options is also causing traders to buy the metals in order to mitigate portfolio volatility. Wall Street and European indices remain negative, so traders are looking to trade commodities. |
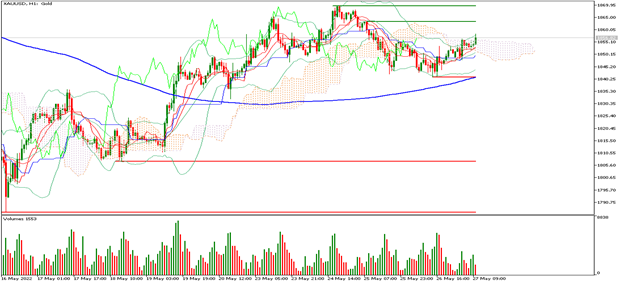 |
| Support 1: 1,850.75 Support 2: 1,848.56 Support 3: 1,846.72 Resistance 1: 1,854.78 Resistance 2: 1,856.62 Resistance 3: 1,858.81 Pivot Point: 1,852.59 |
| The price is above the 200-day moving average, between resistance 1 and support 1. Expected trading range between USD$1,846 and USD$1,858. Pivot point for trend change at USD$1,852. RSI neutral, so the price could climb towards USD$1,869. |
| NATURAL GAS -0.99% |
| Yesterday the price of natural gas reached USD$9.42 per BTU. Meanwhile, the European Union and Asian importers are seeking to close long-term LNG supply agreements. In Spain, an austerity plan for natural gas consumption has begun. The same is expected to happen in Europe, due to the increase in demand due to the summer and the shortage of the commodity as a result of the war in Ukraine. |
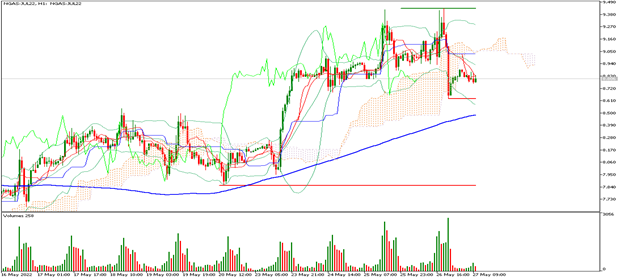 |
| Support 1: 8.741 Support 2: 8.703 Support 3: 8.642 Resistance 1: 8.840 Resistance 2: 8.901 Resistance 3: 8.939 Pivot Point: 8.802 |
| The price is above the 200-day moving average, between resistance 3 and support 1. Expected trading range between USD$8.64 and USD$8.93. Pivot point for trend change at USD$8.80. RSI neutral, so the price could correct towards USD$8.58. |
| Sources |
| Reuters Market watch Bloomberg Capitalix Market Research |
Risk Disclaimer
Any information/articles/materials/content provided by Capitalix or displayed on its website is intended to be used for educational purposes only and does not constitute investment advice or a consultation on how the client should trade.
Although Capitalix has ensured that the content of such information is accurate, it is not responsible for any omission/error/miscalculation and cannot guarantee the accuracy of any material or any information contained herein.
Therefore, any reliance you place on such material is strictly at your own risk. Please note that the responsibility for using or relying on such material rests with the client and Capitalix accepts no liability for any loss or damage, including without limitation, any loss of profit which may arise directly or indirectly from the use of or reliance on such information.
Risk Warning: Forex/CFDs trading involves significant risk to your invested capital. Please read and make sure that you fully understand our Risk Disclosure Policy.
You should ensure that, depending on your country of residence, you are allowed to trade Capitalix.com products. Please ensure that you are familiar with the company’s risk disclosure.