Daily Review for July 14, 2022
The market was anticipating it, inflation in the US for the month of June came in at 9.1% year-over-year or 0.7% month-over-month. This generated high volatility in the financial markets, mainly in Wall Street.
The Nasdaq 100 is presenting mixed movements, taking a sideways trend. The US inflation report generated a drop in the index to 11,494 points.
The price of natural gas continues to rise as demand in Europe increases. The Nord Stream pipeline continues to undergo maintenance, so there is currently no supply from Russia to Europe through Germany.
The SEC postponed the decision on ARK Invest’s Bitcoin ETF to August 30, 2022. Due to high inflation in the USA, the price of Bitcoin fell close to USD$18,000.
| DOW JONES -0.38% |
| The market was anticipating it, inflation in the US for the month of June came in at 9.1% year-over-year or 0.7% month-over-month. This generated high volatility in the financial markets, mainly on Wall Street. Analysts are expecting a possible interest rate hike of 1% by the FED in the July 2022 meeting. The Dow Jones is currently up 0.38% and is trading at 30,854. The increase in inflation is partly explained by the 11.2% increase in the price of natural gas during the month, as well as the 1% increase in food prices. |
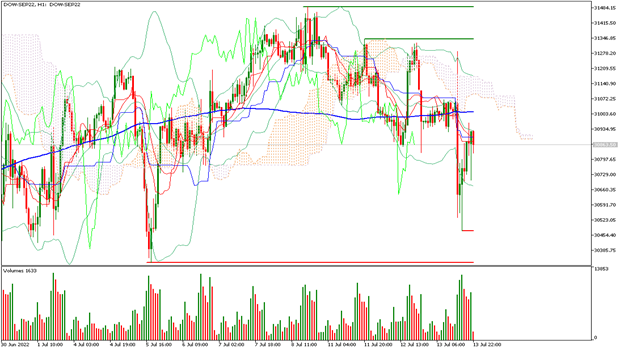 |
| Support 1: 30799.7 Bracket 2: 30659.0 Support 3: 30587.6 Resistance 1: 31011.8 Resistance 2: 31083.2 Resistance 3: 31223.9 Pivot Point: 30871.1 |
| Price is below the 200-day moving average, between resistance 1 and support 1. Expected trading range between 30,587 and 31,223. Pivot point for trend change at 30,871. RSI neutral, so the price could continue to correct towards support 1. |
| NASDAQ 100 -0.02% |
| The Nasdaq 100 is in a mixed trend, moving sideways. The US inflation report caused the index to drop to 11,494 points. High inflation generates market impulses in the short term, which is why the index has managed to recover to 11,770 points. On the other hand, Twitter has sued Elon Musk, so the company’s shares rose 8% during the day. Traders are looking ahead to the Fed rate hike and the corporate earnings season. |
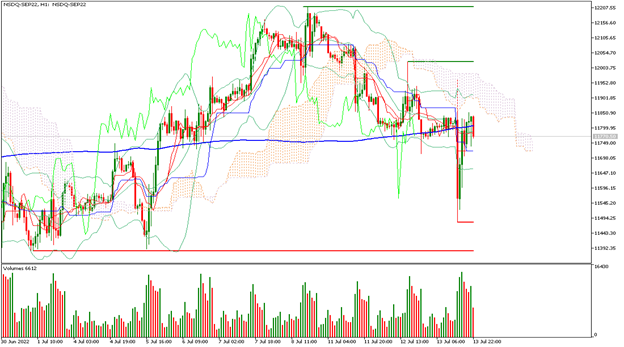 |
| Support 1: 11741.1 Support 2: 11676.8 Support 3: 11644.6 Resistance 1: 11837.6 Resistance 2: 11869.8 Resistance 3: 11934.1 Pivot Point: 11773.3 |
| Price is below the 200-day moving average, between support 1 and resistance 1. Expected trading range between 11,644 and 11,934. Pivot point for trend change at 11,773. RSI neutral, so the index could continue to correct towards support 1 in the short term. |
| NATURAL GAS +7.16% |
| The price of natural gas continues to rise as demand in Europe increases. The Nord Stream pipeline continues to undergo maintenance, so there is currently no supply from Russia to Europe through Germany. Canada is increasing LNG exports to Europe. The price of natural gas is currently up 7.16% and is trading at USD$6.60 per BTU. The Bulls have set a new target at USD$8 per BTU. |
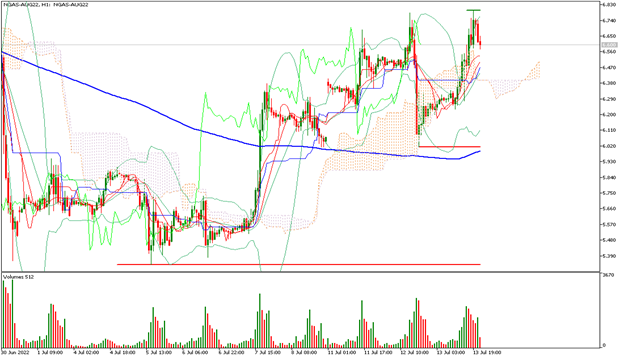 |
| Support 1: 6,574 Support 2: 6.528 Support 3: 6.443 Resistance 1: 6.705 Resistance 2: 6.790 Resistance 3: 6.836 Pivot Point: 6.659 |
| Price is above the 200-day moving average, between resistance 2 and support 1. Expected trading range between USD$6.44 and USD$6.83. Pivot point for trend change at USD$6.65. RSI neutral, so the price may continue to rise towards USD$7 per BTU. |
| BITCOIN +1.25% |
| The SEC postponed the decision on ARK Invest’s Bitcoin ETF to August 30, 2022. Due to high inflation in the US, the Bitcoin price fell close to USD$18,000. 60% of Wall Street analysts believe the price could fall towards USD$10,000. Bulls, meanwhile, see that inflation has peaked, so the price could start to rebound. At the moment the positions are mixed. Bitcoin is currently up 1.25% and is trading at USD$19,619. |
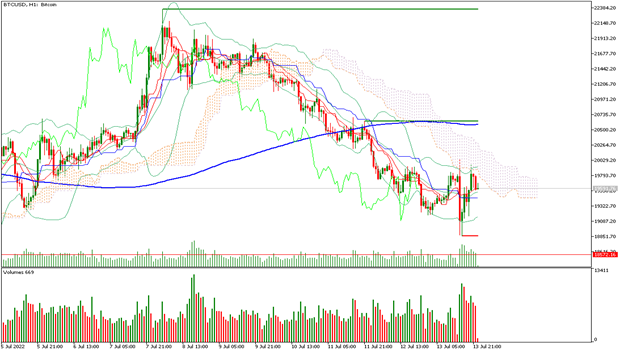 |
| Support 1: 19561.8 Support 2: 19480.9 Support 3: 19331.8 Resistance 1: 19791.8 Resistance 2: 19940.9 Resistance 3: 20021.8 Pivot Point: 19710.9 |
| Price is below the 200-day moving average, between resistance 1 and support 2. Expected trading range between USD$19,331 and USD$20,021. Pivot Point for trend change at USD$19,710. RSI neutral, so the price could remain sideways trying to recover the USD$20,000. |
| Sources |
| Reuters Market watch Bloomberg Capitalix Market Research |
Risikohinweis
Alle von Capitalix bereitgestellten oder auf seiner Webseite angezeigten Informationen/Artikel/Materialien/Inhalte sind ausschließlich zu Bildungszwecken bestimmt und stellen keine Anlageberatung oder Beratung darüber dar, wie der Kunde handeln sollte.
Obwohl Capitalix sich vergewissert hat, dass der Inhalt dieser Informationen korrekt ist, haftet Capitalix nicht für Auslassungen/Fehler/Fehlkalkulationen und kann nicht für die Richtigkeit des Materials oder der hierin enthaltenen Informationen garantieren.
Wenn Sie sich auf dieses Material verlassen, geschieht dies daher ausschließlich auf Ihr eigenes Risiko. Bitte beachten Sie, dass die Verantwortung für die Nutzung von oder das Vertrauen auf dieses Material beim Kunden liegt und Capitalix keine Haftung für Verluste oder Schäden übernimmt, einschließlich, aber nicht beschränkt auf, Gewinnverluste, die direkt oder indirekt aus der Nutzung oder dem Vertrauen auf diese Informationen entstehen können.
Risikowarnung: Der Handel mit Devisen/CFDs birgt erhebliche Risiken für Ihr investiertes Kapital. Bitte lesen Sie unsere Risikoaufklärung und vergewissern Sie sich, dass Sie sie vollständig verstanden.
Sie sollten sich vergewissern, dass Sie je nach Land, in dem Sie wohnen, mit Capitalix.com-Produkten handeln dürfen. Bitte vergewissern Sie sich, dass Sie mit der Risikoaufklärung des Unternehmens vertraut sind.