Daily Review for June 06, 2022
Global stock markets start the week with mixed movements. In Europe, stock indexes are showing upward movements, mainly in the Eurostoxx 50.
Bitcoin starts the week with an important rebound. It is currently up 5.32% and is trading at USD$31,334.
Analysts evaluate the short-term demand for natural gas. It is increasing due to the summer in Europe and in the Northern Hemisphere.
Gold prices showed a correction from USD$1,874 to the current level of USD$1,856. At the moment the metal is up 0.33%.
| EUROSTOXX 50 +0.93% |
| Global stock markets start the week with mixed movements. In Europe, stock indices are showing upward movements, mainly in the Eurostoxx 50, which is up 0.93% and is trading at 3,798 points. Last Friday, the Non-Farm Payrolls report showed an increase of 390,000 new jobs in the month of May 2022 in the USA. The US unemployment rate came in at 3.6%. Both indicators exceeded market expectations. More attention is expected this week from the European Central Bank’s monetary policy. |
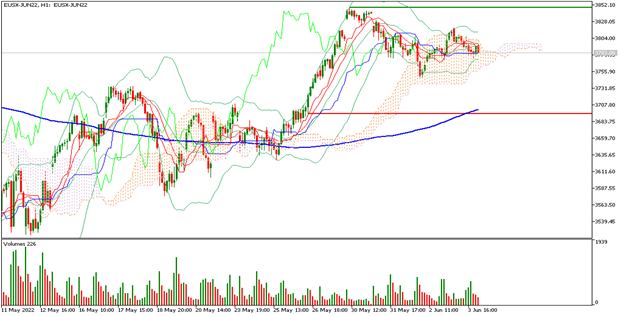 |
| Support 1: 3,787 Support 2: 3,785 Support 3: 3,784 Resistance 1: 3,790 Resistance 2: 3,791 Resistance 3: 3,793 Pivot Point: 3,788 |
| The price is above the 200-day moving average, between support 1 and resistance 1. Expected trading range between 3,784 and 3,793. Pivot point for trend change at 3,788. RSI neutral, so the index could maintain the uptrend towards 3,848 points. |
| BITCOIN +5.32% |
| Bitcoin starts the week with a significant rebound. It is currently up 5.32% and is trading at USD$31,334. The whales have started to enter the market again. The short-term target for traders is at the USD$34,000 resistance. Analysts believe that Bitcoin could continue to rise driven by long-term holders and inflation levels. On the other hand, investors continue to watch for the release of Ethereum’s update to the market. |
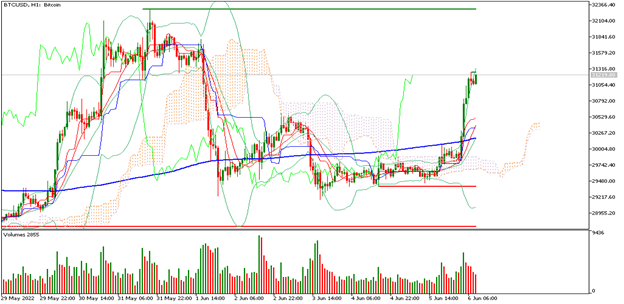 |
| Support 1: 31,135.2 Support 2: 31,086.3 Support 3: 31,004.4 Resistance 1: 31,266.0 Resistance 2: 31,347.9 Resistance 3: 31,396.7 Pivot Point: 31,217.1 |
| The price is above the 200-day moving average, between resistance 2 and support 1. Expected trading range between USD$31,004 and USD$31,396. Pivot point for trend change at USD$31,217. RSI in overbought zone, so traders could start taking profits. |
| NATURAL GAS +3.58% |
| Analysts assess near-term demand for natural gas. It is increasing due to the summer in Europe and the Northern Hemisphere. The price is currently up 3.58% and is trading at USD$8.82 per BTU. A rebound in the price is expected, driven by the European Union sanctions on the Russian energy market, which may increase the supply shock in the market, generating in turn inflation in the energy market. |
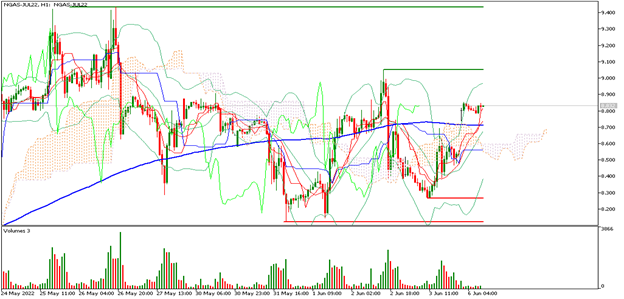 |
| Support 1: 8.810 Support 2: 8.787 Support 3: 8.768 Resistance 1: 8.852 Resistance 2: 8.871 Resistance 3: 8,894 Pivot Point: 8.829 |
| The price is above the 200-day moving average, between resistance 1 and support 1. Expected trading range between USD$8.76 and USD$8.89. RSI near the overbought zone, so prices could correct some points before continuing the uptrend. The short-term target for the Bulls is at USD$9.44 per BTU. |
| GOLD +0.33% |
| Gold prices presented a correction from USD$1,874 to the current level of USD$1,856. At the moment the metal is up 0.33%. Traders are looking to keep the metal in their portfolios, due to short-term volatility caused by inflation, the decision on interest rates in the US and Europe and the war in Ukraine. Wall Street investment banks continue to expect at least 5 to 6 additional rate hikes from the Fed. The first ECB rate hike is also expected in July 2022. |
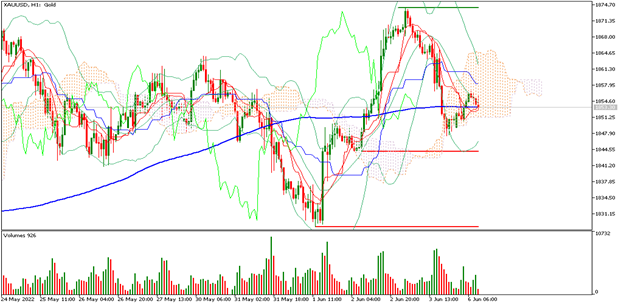 |
| Support 1: 1,855.44 Support 2: 1,854.42 Support 3: 1,853.09 Resistance 1: 1,857.79 Resistance 2: 1,859.12 Resistance 3: 1,860.14 Pivot Point: 1,856.77 |
| The price is above the 200-day moving average between resistance 2 and support 1. Expected trading range between USD$1,853 and USD$1,860. RSI neutral, so gold could continue to present buying volume and bullishness in the price until the next resistance. |
| Sources |
| Reuters Market watch Bloomberg Capitalix Market Research |
Divulgation des risques
Toute information/article/matériel/contenu fourni par Capitalix ou affiché sur leur site web est destiné à être utilisé à des fins éducatives uniquement et ne constitue pas un conseil d’investissement ou une consultation sur la façon dont le client devrait faire du trading.
Bien que Capitalix ait veillé à l’exactitude du contenu de ces informations, elle n’est pas responsable de toute omission/erreur/malentendu et ne peut garantir l’exactitude de tout matériel ou de toute information contenue dans ce document.
Par conséquent, toute confiance que vous accordez à ce matériel est strictement à vos propres risques. Veuillez noter que la responsabilité de l’utilisation ou de la fiabilité de ce matériel incombe au client et que Capitalix n’accepte aucune responsabilité pour toute perte ou tout dommage, y compris, sans s’y limiter, toute perte de profit pouvant découler directement ou indirectement de l’utilisation ou de la fiabilité de ces informations.
Avertissement de risque: Le trading de Forex/CFDs implique un risque conséquent pour votre capital. Veuillez lire et vous assurer que vous comprenez parfaitement notre Politique de claude de non-responsabilité.
Vous devez vous assurer que, selon votre pays de résidence, vous êtes autorisé à trader les produits de Capitalix.com. Veuillez vous assurer que vous êtes familier avec la divulgation des risques de l’entreprise.