Daily Review for September 30, 2021
IEA confirmed the increase in crude oil inventories in the United States. inventories raised by 4.5 million barrels, mainly due to the return of production capacity in the Gulf of Mexico.
Macroeconomic data day in Europe. The main indicators on traders’ radar are inflation and unemployment data.
Nasdaq 100 rebound. Technology companies with the largest market capitalization return to traders’ portfolios.
Bitcoin rebounds and seeks the resistance of USD$44,000. If the Bulls break above this zone, the way would be clear towards USD$50,000.
| WTI -0.11% |
| The IEA inventories report confirmed the increase of 4.5 million barrels of crude oil in the United States. For this reason, the WTI rally was halted at USD$76.78. The price is currently down 0.11% and is trading at USD$74.72 per barrel. The increase in US inventories confirms that the total production capacity in the Gulf of Mexico is almost fully operational. On the other hand, OPEC+ continues with the strategy of increasing production by 400,000 barrels per day as of November 2021. |
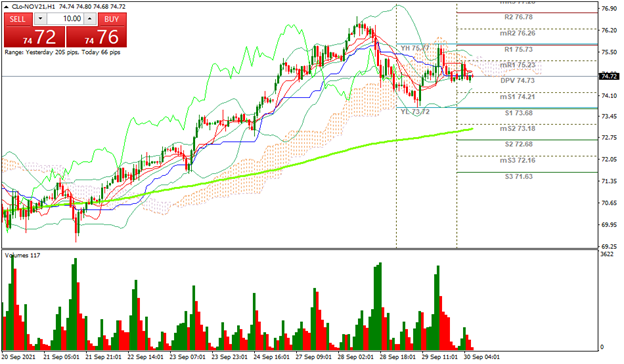 |
| Support 1: 74.60 Support 2: 74.47 Support 3: 74.38 Resistance 1: 74.82 Resistance 2: 74.91 Resistance 3: 75.04 Pivot Point: 74.69 |
| The price is above the 200-day moving average. WTI dropped towards support 1 at USD$73.72, and then rebounded towards the USD$75.73 area. At the moment, the price is trending sideways towards the USD$74 zone. Pivot point at USD$74.69. RSI neutral. |
| DAX 40 +0.58% |
| DAX 40 is currently up 0.58% and is trading at 15,412. In Europe, we will have a day full of macro-economic data. In the UK, quarterly GDP is expected at 4.8% for Q2. In France, monthly inflation is expected at -0.1%. In Germany, unemployment rate is expected at 5.4% and monthly inflation rate at 0.1%. In Italy, the expected CPI is -0.3% monthly. Finally, analysts estimate a consolidated Eurozone unemployment rate of 7.5% for August 2021. |
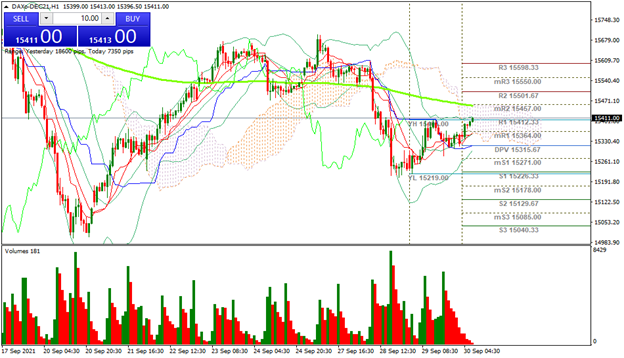 |
| Support 1: 15,380.9 Support 2: 15,367.7 Support 3: 15,358.4 Resistance 1: 15,403.4 Resistance 2: 15,412.7 Resistance 3: 15,425.9 Pivot Point: 15,390.2 |
| The index resumed the uptrend after descending to the support at 15,219. From there, it headed towards the current zone of 15,457. If the price breaks above the 200-day moving average, the next zone to attack is 15,720. Trading range between 15,358 and 15,425. Pivot point at 15,390. RSI neutral. |
| NASDAQ 100 +0.86% |
| The Nasdaq 100 is rebounding after two days of negative closes. The index is currently up 0.86% and is trading at 14,512. The recovery of the index is being driven by the good closes of technology companies. These include Amazon, Facebook, Microsoft, Apple and Alphabet. Traders have started to add shares of these companies to their portfolios. On the other hand, the market continues to keep an eye on the US debt level. At the Congress, Republicans and Democrats are discussing the best possible way out of the debt maturity payment. |
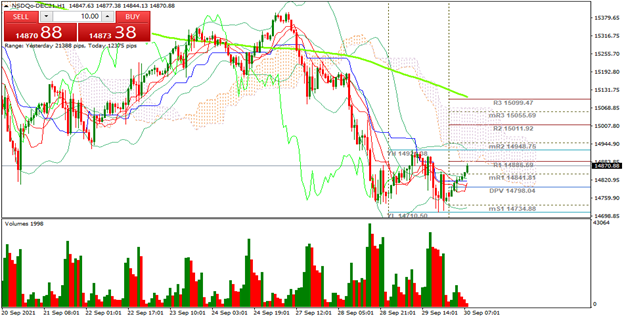 |
| Support 1: 14,847.9 Support 2: 14,835.9 Support 3: 14,829.8 Resistance 1: 14,866.0 Resistance 2: 14,872.1 Resistance 3: 14,884.1 Pivot Point: 14,854.0 |
| The price rebounded from the double bottom formed at 14,734. At the moment, the bullish momentum is at resistance 1. If the Bulls manage to overcome this zone, the price could rise towards resistance at 15,099. Pivot point at 14,854. RSI neutral. |
| BITCOIN +3.20% |
| Significant Bitcoin rebound after negative movements. Bitcoin evidenced a bearish channel up to the USD$40,715 support. From this point, Bulls started buying, pushing the price towards the current level of USD$43,530. Bitcoin is currently up 3.20%. Traders are looking to consolidate the position and look for additional rallies, in order to push the price up and maintain the support at USD$41,000. On the other hand, analysts continue to evaluate the historical movements of Bitcoin, in order to define whether it can be affirmed or not, as a hedging instrument against inflation. |
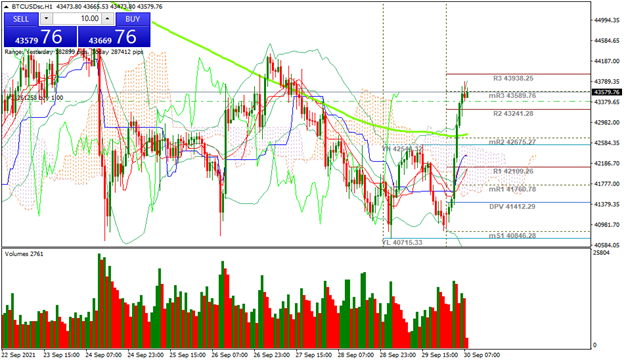 |
| Support 1: 43,368.2 Support 2: 43,228.2 Support 3: 43,004.1 Resistance 1: 43,732.4 Resistance 2: 43,956.6 Resistance 3: 44,096.6 Pivot Point: 43,592.4 |
| The price is at resistance 3. If the price overcomes this level and the resistance of USD$44,000, the Bitcoin would have a clear path towards USD$50,000. Trading range between USD$43,004 and USD$44,096. Pivot point at USD$43,592. RSI in overbought zone. |
| Sources |
| Reuters Market watch Bloomberg Capitalix Market Research |
Risk Disclaimer
Any information/articles/materials/content provided by Capitalix or displayed on its website is intended to be used for educational purposes only and does not constitute investment advice or a consultation on how the client should trade.
Although Capitalix has ensured that the content of such information is accurate, it is not responsible for any omission/error/miscalculation and cannot guarantee the accuracy of any material or any information contained herein.
Therefore, any reliance you place on such material is strictly at your own risk. Please note that the responsibility for using or relying on such material rests with the client and Capitalix accepts no liability for any loss or damage, including without limitation, any loss of profit which may arise directly or indirectly from the use of or reliance on such information.
Risk Warning: Forex/CFDs trading involves significant risk to your invested capital. Please read and make sure that you fully understand our Risk Disclosure Policy.
You should ensure that, depending on your country of residence, you are allowed to trade Capitalix.com products. Please ensure that you are familiar with the company’s risk disclosure.