Daily Review for September 29, 2021
Equities look to recover yesterday’s losses. Central banks continue to discuss monetary policy. Janeth Yellen calls for immediate congressional action on the US debt ceiling to prevent the country from defaulting.
Surprising increase in U.S. inventories. The API report announced an increase of 4.1 million barrels. Today, traders are looking to confirm the data with the IEA report.
Gold price is starting to grab investors’ attention. Equity market volatility is projected to increase ahead of the FED and ECB statements.
Cryptos look to generate a new rally through the completion of the Ethereum 2.0 upgrade.
| DOW JONES +0.42% |
| Wall Street stock indexes are looking to rebound after yesterday’s significant market decline. Dow Jones closed down 1.63%, the S&P500 down 2.04% and the Nasdaq 100 down 2.83%. At the moment the Dow Jones is up 0.42% and is trading at 34,477. Several factors have impacted the market. One of them is Evergrande, and the second most important, is the lack of linearity between central banks. Also, the Fed has received significant criticism from Janeth Yellen. As a result, traders have opted to sell equities and move into fixed income while markets stabilize. |
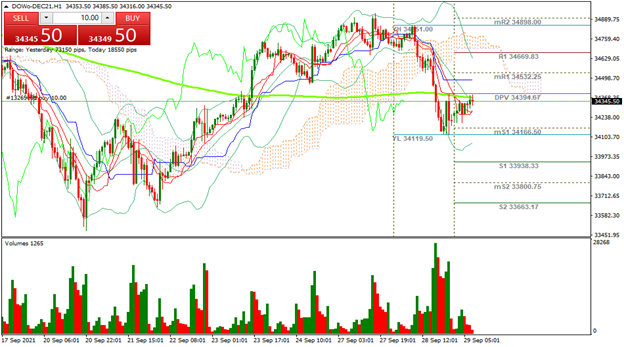 |
| Support 1: 34,444.2 Support 2: 34,393.4 Support 3: 34,357.3 Resistance 1: 34,531.1 Resistance 2: 34,567.2 Resistance 3: 34,618.0 Pivot Point: 34,480.3 |
| The price rebounded from 34,166 and is now at the pivot point, which could confirm the trend change. Trading range between 34,357 and 34,618. Price could break above the 200-day moving average point. If it does, it could recover 34,898. Pivot point at 34,480. |
| WTI -1.61% |
| Crude oil price is turning around and started to drop some points. According to API, crude oil inventories increased by 4.1 million barrels in the United States. This significant increase caused the price to fall from the resistance of USD$76.70. At this moment, the price continues to fall, with a current drop of 1.61% and trading at USD$74.03 per barrel. The price of energy in Europe continues to rise. Traders are looking forward to today’s IEA report. That in order to confirm the increase in inventories. Analysts, however, expect inventories to fall by 1.6 million barrels. |
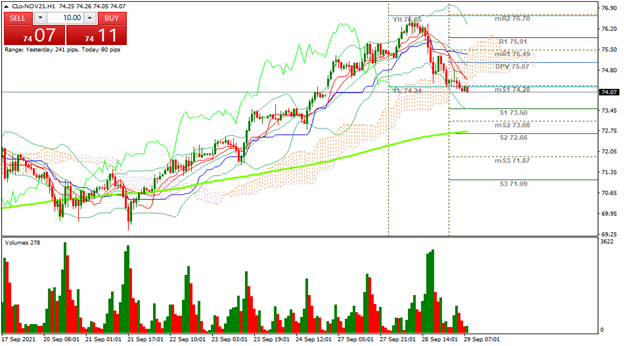 |
| Support 1: 74.15 Support 2: 74.03 Support 3: 73.95 Resistance 1: 74.35 Resistance 2: 74.43 Resistance 3: 74.55 Pivot Point: 74.23 |
| The price continues above the 200-day moving average. At this moment it crossed the Ichimoku cloud and started to look for the support 1. If the increase in inventories is confirmed, the price could go down towards the support line 2 or 3. |
| GOLD +0.16% |
| Important moment in the financial markets. The United States, as the largest economy in the world, could default. Therefore, the Congress is working between Democrats and Republicans to raise the debt ceiling. In continuation of the above, today we will have statements from Jerome Powell, Chairman of the FED and Christine Lagarde, President of the ECB. Meanwhile, traders continue to buy gold and other metals. Gold is currently up 0.16% and is trading at USD$1,740 per Troy ounce. |
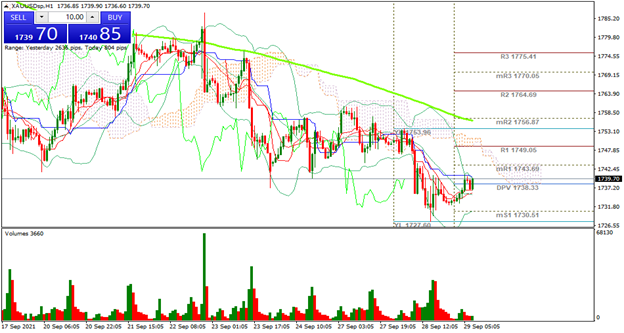 |
| Support 1: 1,736.89 Support 2: 1,735.62 Support 3: 1,733.69 Resistance 1: 1,740.09 Resistance 2: 1,742.02 Resistance 3: 1,743.29 Pivot Point: 1,738.82 |
| The price is at the pivot point where a trend reversal could be confirmed. If so, gold would look to break above the 200-day moving average line. Expected trading range between USD$1,733 and USD$1,743. Pivot point at USD$1,738. RSI neutral. |
| BITCOIN -0.45% |
| Crypto market also suffered from yesterday’s sell-off. During the Asian session, the price of Bitcoin regained the USD$42,000 zone. At the moment the price is falling 0.45% and is trading at USD$42,200. Institutions are buying again at this level, mainly due to the completion of the Ethereum 2.0 upgrade. If the volume of buying is significant, we could witness a change of trend in cryptos, after days of sidewaysness. |
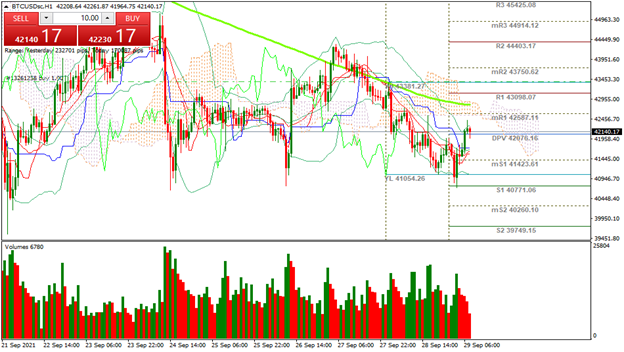 |
| Support 1: 42,110.3 Support 2: 41,974.3 Support 3: 41,802.3 Resistance 1: 42,418.2 Resistance 2: 42,590.1 Resistance 3: 42,726.1 Pivot Point: 42,282.2 |
| The price is below the 200-day moving average, which is a bearish signal for Bitcoin. Expected trading range between USD$41,802 and USD$42,726. Pivot point for trend change at USD$42,282. RSI neutral. |
| Sources |
| Reuters Market watch Bloomberg Capitalix Market Research |
Risk Disclaimer
Any information/articles/materials/content provided by Capitalix or displayed on its website is intended to be used for educational purposes only and does not constitute investment advice or a consultation on how the client should trade.
Although Capitalix has ensured that the content of such information is accurate, it is not responsible for any omission/error/miscalculation and cannot guarantee the accuracy of any material or any information contained herein.
Therefore, any reliance you place on such material is strictly at your own risk. Please note that the responsibility for using or relying on such material rests with the client and Capitalix accepts no liability for any loss or damage, including without limitation, any loss of profit which may arise directly or indirectly from the use of or reliance on such information.
Risk Warning: Forex/CFDs trading involves significant risk to your invested capital. Please read and make sure that you fully understand our Risk Disclosure Policy.
You should ensure that, depending on your country of residence, you are allowed to trade Capitalix.com products. Please ensure that you are familiar with the company’s risk disclosure.