Daily Review for September 24, 2021
Stock indices remain mixed due to the silence of Evergrande’s.
Traders are attentive to the volatility that could be generated by the company’s declaration of default.
Metals begin to change trend. The allocation of portfolios returns to add gold and silver.
In Europe, the market is attentive to Sunday’s elections in Germany. Today, the LFO business confidence index is presented in Germany.
Energy prices in Europe continue to rise. Energy commodity prices keep prices above the 200-day moving average.
| DOW JONES +0.02% |
| Hedge funds and traders continue to keep an eye on Evergrande. The company’s stock is currently down 7% as a result of uncertainty over the company’s offshore debt repayment. The company’s total liabilities are USD$300 billion. Short-term financial obligations amount to USD$37 billion. The possible contagion effect would be through international banks, where BlackRock, UBS, HSBC and Ashmore Group, have an exposure of USD$1.3 Billion on Evergrande’s debt. At this moment the Dow Jones is up 0.02% and is trading at 34,777. |
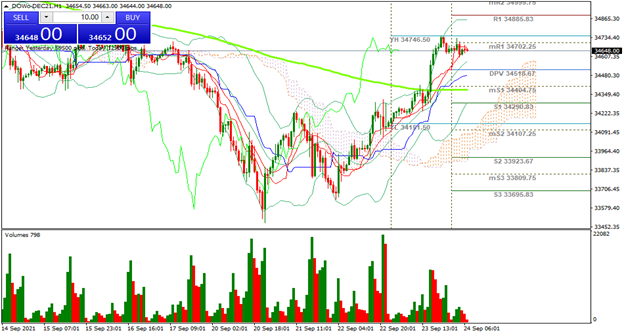 |
| Support 1: 34,763.8 Support 2: 34,738.5 Support 3: 34,713.8 Resistance 1: 34,813.8 Resistance 2: 34,838.5 Resistance 3: 34,863.8 Pivot Point: 34,788.5 |
| The index is moving sideways above resistance 1. If there is a market correction due to the Evergrande effect, the price could head towards the 34,222 area. Trading range between 34,713 and 34,863. Pivot point at 34,788. RSI leaving the overbought zone. |
| GOLD +0.06% |
| Possible change of trend in metals. The market continues to follow Evergrande case. Traders are attentive to the volatility that could occur in the market in the event that the company defaults. As a result, investors have started to buy gold and silver. Gold is currently up 0.06% and is trading at USD$1,750 per troy ounce. Stock indices are mixed as are Treasury yields. |
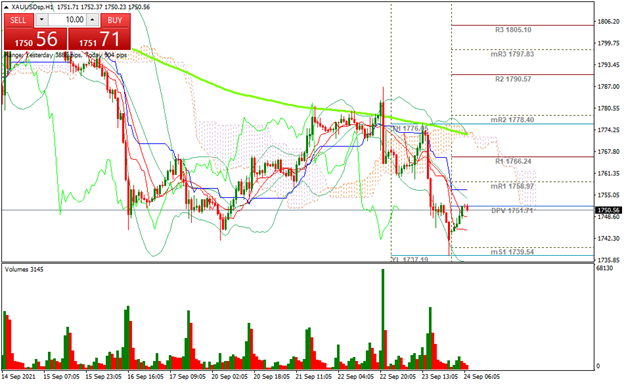 |
| Support 1: 1,751.31 Support 2: 1,750.68 Support 3: 1,750.01 Resistance 1: 1,752.61 Resistance 2: 1,753.28 Resistance 3: 1,753.91 Pivot Point: 1,751.98 |
| The price is bouncing from support 1. At the moment it is at the pivot point, where a change of trend could occur. Expected trading range between USD$1,750 and USD$1,753. Pivot point at USD$1,751. RSI neutral. |
| DAX 40 -0.14% |
| Germany Election on Sunday. According to the polls results, the Social Democratic Party, with its candidate Olaf Scholz, has the highest probability of victory. Businessmen in Germany, in the EU and globally have been attentive to the candidates propositions. On the other hand, the USA maintains the financial restrictions on China, with which Germany has not wanted to maintain a firm position, due to the fact that the main customer of the German automotive industry is China. At the moment the DAX 40 is down 0.14% and is trading at 15,612. |
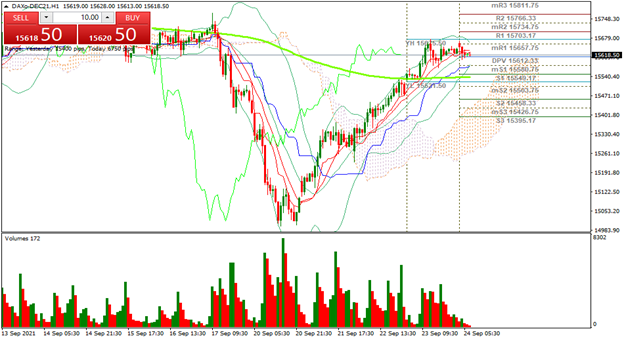 |
| Support 1: 15,618.4 Support 2: 15,611.2 Support 3: 15,605.9 Resistance 1: 15,630.9 Resistance 2: 15,636.2 Resistance 3: 15,643.4 Pivot Point: 15,623.7 |
| Interesting bounce from the 14,983 zone. At the moment the price is between resistance 1 and the pivot point. Expected trading range between 15,605 and 15,643. Pivot point for trend change at 15,623. RSI leaving the overbought zone. |
| CRUDE OIL +0.08% |
| Energy prices in Europe continue to rise. WTI is up 0.08% and is trading at USD$73.35. Goldman Sachs’ most recent projection puts crude oil at USD$90 per barrel. U.S. crude inventories continue to decline. Production in the Gulf of Mexico has not yet reached 100% of its installed capacity. In the futures market, the price of crude oil for delivery in January 2022 is higher than in subsequent months, so traders and O&G companies are trying to close as much business as possible at this time. |
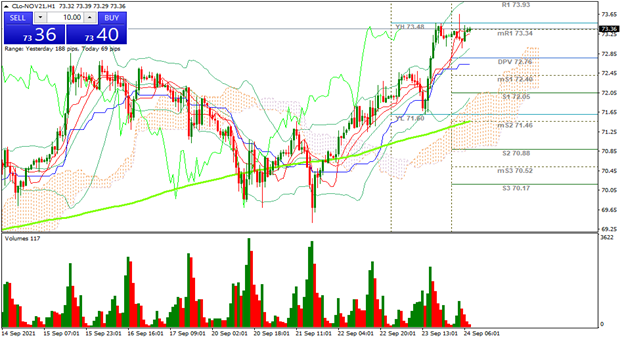 |
| Support 1: 73.29 Support 2: 73.26 Support 3: 73.21 Resistance 1: 73.37 Resistance 2: 73.42 Resistance 3: 73.45 Pivot Point: 73.34 |
| The price bounced from support 2. At the moment it is at resistance 1. Trading range between USD$73.21 and USD$73.45. Pivot point at USD$73.34. RSI in overbought zone. The WTI is in an uptrend zone, and maintains the position above the 200-day moving average. |
| Sources |
| Reuters Market watch Bloomberg Capitalix Market Research |
Risk Disclaimer
Any information/articles/materials/content provided by Capitalix or displayed on its website is intended to be used for educational purposes only and does not constitute investment advice or a consultation on how the client should trade.
Although Capitalix has ensured that the content of such information is accurate, it is not responsible for any omission/error/miscalculation and cannot guarantee the accuracy of any material or any information contained herein.
Therefore, any reliance you place on such material is strictly at your own risk. Please note that the responsibility for using or relying on such material rests with the client and Capitalix accepts no liability for any loss or damage, including without limitation, any loss of profit which may arise directly or indirectly from the use of or reliance on such information.
Risk Warning: Forex/CFDs trading involves significant risk to your invested capital. Please read and make sure that you fully understand our Risk Disclosure Policy.
You should ensure that, depending on your country of residence, you are allowed to trade Capitalix.com products. Please ensure that you are familiar with the company’s risk disclosure.