Daily Review for September 17, 2021
Crucial day for indices and stocks as options and futures contracts expire in the market.
Wall Street indices remain in positive territory driven by retail sales in the United States.
DAX 30 is in positive territory, and traders in Europe are keeping an eye on the Euro Zone inflation data.
The energy market continues to trend higher. Natural gas continues to rise.
Crude oil is down a few points. Gulf of Mexico production remains stuck at 28%.
Opportunity for gold to become the safe-haven asset for traders today. The expiration of options and futures may generate corrections in indices and stocks. Therefore, investors have started to buy metals.
| S&P500 +0.10% |
| Index futures on Wall Street are in positive territory boosted by good retail sales data in the United States. At the moment the S&P500 is up 0.10% and is trading at 4,477. Traders are looking ahead to the quarterly expiration of index and equity futures and options. Positions are mixed. Those with good profits will close out positions, and those in balance may roll over to new contracts. |
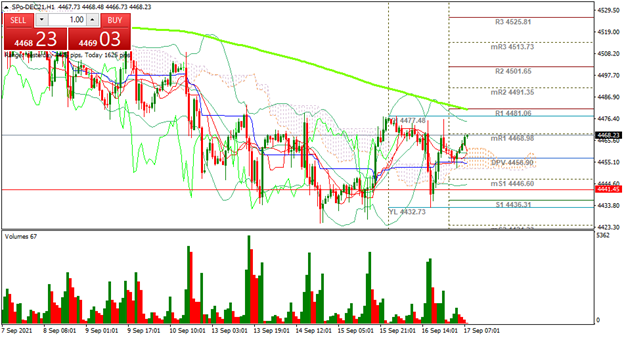 |
| Support 1: 4,474.9 Support 2: 4,471.8 Support 3: 4,470.2 Resistance 1: 4,479.6 Resistance 2: 4,481.2 Resistance 3: 4,484.3 Pivot Point: 4,476.5 |
| The price is below the 200-day moving average. However, the index bounced off support 1, and is heading towards resistance 1. Expected trading range between 4,470 and 4,484. Pivot point at 4,476. RSI neutral. If the price overcomes resistance 1, it could find support at 4,481. Bulls are looking for 5,000. |
| DAX 30 +0.08% |
| Traders are keeping an eye on UK retail sales and Eurozone inflation data. At the moment, the DAX 30 is up 0.08% and is trading at 15,708. On an annual basis, analysts expect Euro Zone inflation of 3%. If this comes true, inflation would be 1% above the ECB’s target. If the figure exceeds the market’s expectations, the ECB could act quickly to control the price level. For the time being, the bank has started to taper its monthly purchases of fixed income instruments. |
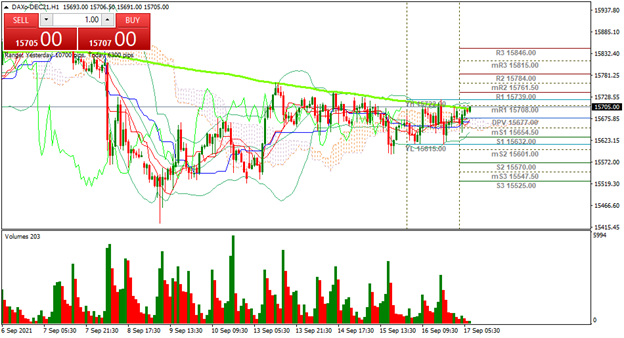 |
| Support 1: 15,691.4 Support 2: 15,684.2 Support 3: 15,678.9 Resistance 1: 15,703.9 Resistance 2: 15,709.2 Resistance 3: 15,716.4 Pivot Point: 15,696.7 |
| The price is above the 200-day moving average. The index is looking for the bullish channel from resistance 1. If it manages to overcome this level, the next target is 15,784. Expected trading range between 15,678 and 15,716. Pivot point at 15,696. RSI neutral. |
| CRUDE OIL -0.19% |
| Natural Gas prices continue with an upward trend. They are currently up 0.42% and are trading at USD$5.29 per BTU. Crude oil prices are currently down 0.19% and are trading at USD$72.42 per barrel. Energy prices in Europe continue to rise. Still 28% of the oil production facilities in the Gulf of Mexico are offline. Libyan oil exports return to the market. The energy market continues to trend higher, driven by fundamentals. |
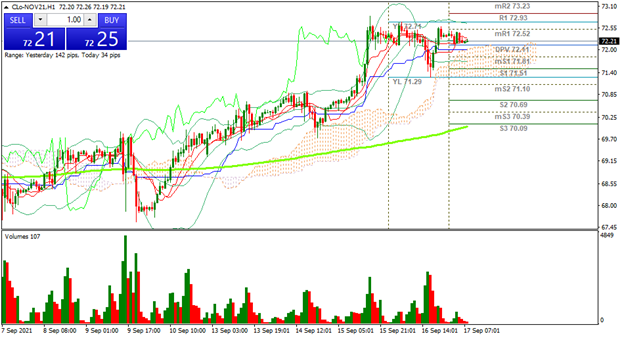 |
| Support 1: 72,41 Support 2: 72,39 Support 3: 72,36 Resistance 1: 72,46 Resistance 2: 72,49 Resistance 3: 72,51 Pivot Point: 72,44 |
| The price is above the 200-day moving average. Expected trading range between USD$72.36 and USD$72.51. Pivot point at USD$72.44. RSI neutral. Bullish trend. Possible sideways movement, before continuing the trend. |
| GOLD +0.43% |
| Important day in the market due to the expiration of futures and options. Stock markets could show an important correction, if the volume of sales exceeds the rollover of contracts. If so, traders have started to buy gold and other metals to mitigate the risk of volatility in portfolios. At the moment the price of gold is up 0.43% and is trading at USD$1,761 per Troy ounce. Bullish trend. |
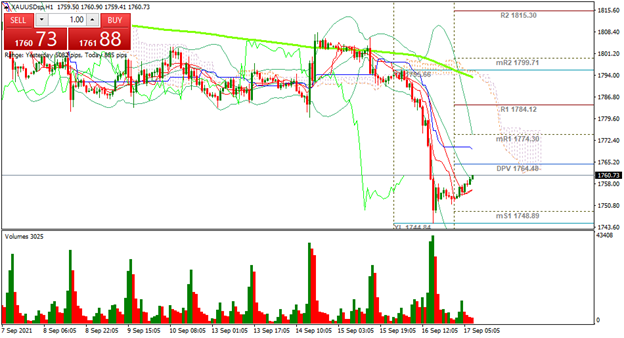 |
| Support 1: 1,758.73 Support 2: 1,757.01 Support 3: 1,756.11 Resistance 1: 1,761.35 Resistance 2: 1,762.25 Resistance 3: 1,763.97 Pivot Point: 1,759.63 |
| The price is bouncing from the level of support 1 and is approaching the pivot point, so it could generate a change of trend. If this is confirmed, the price could reach the level of resistance 2, even recovering the USD$1.800. RSI neutral. |
| Sources |
| Reuters Market watch Bloomberg Capitalix Market Research |
Risk Disclaimer
Any information/articles/materials/content provided by Capitalix or displayed on its website is intended to be used for educational purposes only and does not constitute investment advice or a consultation on how the client should trade.
Although Capitalix has ensured that the content of such information is accurate, it is not responsible for any omission/error/miscalculation and cannot guarantee the accuracy of any material or any information contained herein.
Therefore, any reliance you place on such material is strictly at your own risk. Please note that the responsibility for using or relying on such material rests with the client and Capitalix accepts no liability for any loss or damage, including without limitation, any loss of profit which may arise directly or indirectly from the use of or reliance on such information.
Risk Warning: Forex/CFDs trading involves significant risk to your invested capital. Please read and make sure that you fully understand our Risk Disclosure Policy.
You should ensure that, depending on your country of residence, you are allowed to trade Capitalix.com products. Please ensure that you are familiar with the company’s risk disclosure.