Daily review for October 27, 2021
Companies reporting results today:
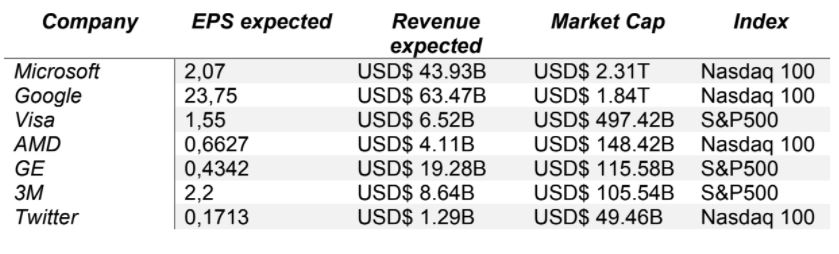
Traders continue to focus on corporate results. This time, they have Dow Jones and S&P500 stocks on their radar.
U.S. crude oil stocks increased by 2 million barrels. Traders are aware of the inventory report.
Metals correct. However, investors continue to be interested in mitigating inflation in their portfolios.
Traders are watching the macroeconomic data in Europe. Asian markets are impacting the European market for the time being.
| NASDAQ 100 +0.07% |
| Microsoft and Google outperformed market expectations. The stocks closed yesterday with rallies of 0.64% and 1.35% respectively. The good results maintained the upward trend of the Nasdaq 100. At the moment the index is up 0.07% and is trading at 15,557 points. Today, we will have the financial results of McDonald’s, Boeing, Coca Cola and General Motors, among other companies. Traders are watching the opening of the air borders between Europe and the United States. Also Delta Plus cases in China. |
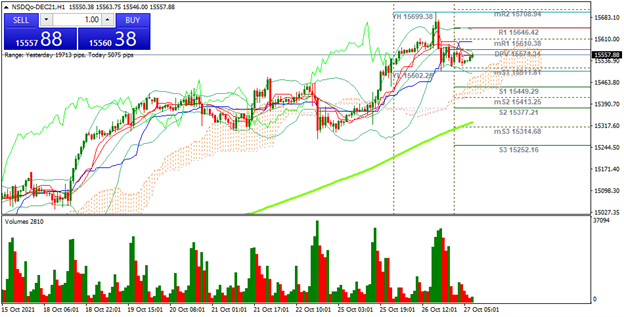 |
| Support 1: 15,552.2 Support 2: 15,544.9 Support 3: 15,541.2 Resistance 1: 15,563.2 Resistance 2: 15,566.9 Resistance 3: 15,574.2 Pivot Point: 15,555.9 |
| The price is above the 200-day moving average. At this moment the index is at the pivot point, so a change of trend is possible. Trading range between 15.541 and 15.574. Pivot point at 15.555. RSI neutral. |
| WTI -0.93% |
| WTI is currently correcting 0.93% and is trading at USD$83.85 per barrel. According to the weekly crude oil stocks report in the United States by API, stocks increased by 2.3 million barrels. In other words, there was higher production and lower demand. This caused the price correction. Today, we will have the weekly crude oil inventories report from the IEA, where analysts expect a reduction in inventories of at least 2 million barrels. Traders are watching the report to validate the increase in inventories. |
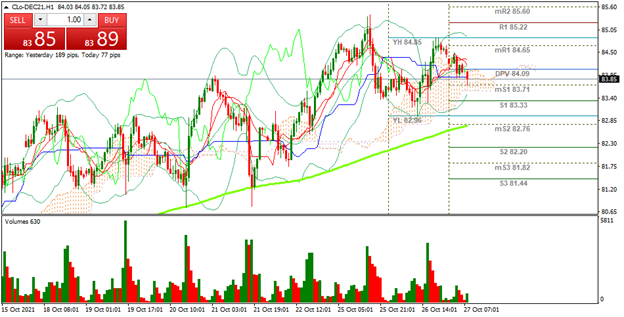 |
| Support 1: 84.04 Support 2: 83.99 Support 3: 83.95 Resistance 1: 84.13 Resistance 2: 84.17 Resistance 3: 84.22 Pivot Point: 84.08 |
| The price remains above the 200-day moving average. Trading range between USD$83.95 and USD$84.22. Pivot point for trend change at USD$84.08. RSI neutral. Possible sideways movement while the trend is confirmed. |
| SILVER -0.23% |
| Silver price is currently correcting 0.23% and is trading at USD$24.04 per Troy ounce. Traders are watching the Bank of Canada’s interest rate decision. Analysts expect the bank to leave the benchmark interest rate unchanged at 0.25%. For the time being, investment funds are concentrating on hedging their portfolios against inflation, and are therefore continuing their buying positions in metals. |
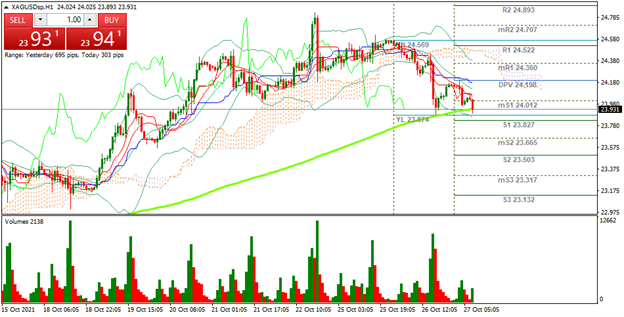 |
| Support 1: 23.939 Support 2: 23.881 Support 3: 23.792 Resistance 1: 24.086 Resistance 2: 24.175 Resistance 3: 24.233 Pivot Point: 24.028 |
| The price is at the same level of the 200-day moving average. The RSI is in the neutral zone, but coming out of oversold, which could present a level of trend change. Expected trading range between USD$23.79 and USD$24.23. Pivot point at USD$24.02. |
| DAX 40 -0.03% |
| Traders are looking to take positions in the German index, depending on the results of the import price index in Germany. Also, today’s European market could see some swings depending on the results of the consumer confidence in France, the trade balance in Italy and the private credit indicator in the Euro Zone. At the moment, the DAX 40 is down 0.03% and is trading at 15,715. |
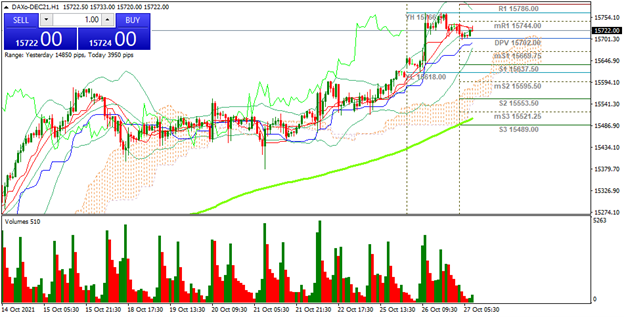 |
| Support 1: 15,718.6 Support 2: 15,708.3 Support 3: 15,700.6 Resistance 1: 15,736.6 Resistance 2: 15,744.3 Resistance 3: 15,754.6 Pivot Point: 15,726.3 |
| The price is above the 200-day moving average. At this moment Bulls are attacking resistance 1. If they manage to overcome this level, the next target is at 15,934. Pivot point for trend change is at 15,726. RSI is neutral. |
| Sources |
| Reuters Market watch Bloomberg Capitalix Market Research |
Risk Disclaimer
Any information/articles/materials/content provided by Capitalix or displayed on its website is intended to be used for educational purposes only and does not constitute investment advice or a consultation on how the client should trade.
Although Capitalix has ensured that the content of such information is accurate, it is not responsible for any omission/error/miscalculation and cannot guarantee the accuracy of any material or any information contained herein.
Therefore, any reliance you place on such material is strictly at your own risk. Please note that the responsibility for using or relying on such material rests with the client and Capitalix accepts no liability for any loss or damage, including without limitation, any loss of profit which may arise directly or indirectly from the use of or reliance on such information.
Risk Warning: Forex/CFDs trading involves significant risk to your invested capital. Please read and make sure that you fully understand our Risk Disclosure Policy.
You should ensure that, depending on your country of residence, you are allowed to trade Capitalix.com products. Please ensure that you are familiar with the company’s risk disclosure.