Daily review for October 18, 2021
Bitcoin starts the week marking upside momentum. Bulls are looking for USD$63,000. If the double top is breached, the road has the route to USD$70,000.
China’s GDP for Q3 2021, fails to beat market expectations. Asian indices show bearish movements. Traders are attentive to the possible impact on the European and American markets.
WTI, Brent, Natural Gas and Thermal Coal are moving upwards. The demand for energy has created an increase in coal production.
Traders are aware of the price of gold. If China affects equities, traders would buy the metal in the current area. Inflation pressure continues in the markets.
| BITCOIN +1.51% |
| Over the weekend, the Bitcoin price reached the current level of USD$62,070. At the moment the price is up 1.51%. The SEC approved the Bitcoin ETF, which provides an new asset to mutual funds that by policy could not invest directly in cryptos. Meanwhile, the next target for the Bulls is located at USD$70.407. If the price manages to overcome the current resistance it could continue the ascending channel. Traders are paying attention to the positions of Hedge Funds. |
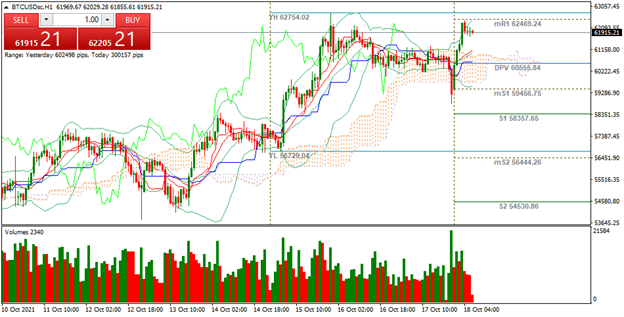 |
| Support 1: 61,686.4 Support 2: 61,822.6 Support 3: 61,974.3 Resistance 1: 62,262.2 Resistance 2: 62,398.4 Resistance 3: 62,550.1 Pivot Point: 62,110.5 |
| The price is at a double top at the resistance of USD$62,469. If the Bulls overcome this zone, the next target is USD$64,380. Pivot point for trend change is at USD$62,110. RSI is neutral, which could lead to further price rallies. Bitcoin continues above the 200-day moving average. |
| NASDAQ 100 -0.28% |
| China presented GDP data for Q3 2021. The Asian country evidenced a growth of 4.9%, which did not exceed market expectations of 5.2%. Likewise, China is showing economic slowdown, as comparing actual figure with data from Q2 2021, where the country grew 7.9%. China GDP data has created sales in the Asian markets, and pressure on U.S. companies that do business with China, mainly technology companies that manufacture or purchase chips in the Asian country. The Nasdaq 100 is currently down 0.28% and is trading at 15,104 points. |
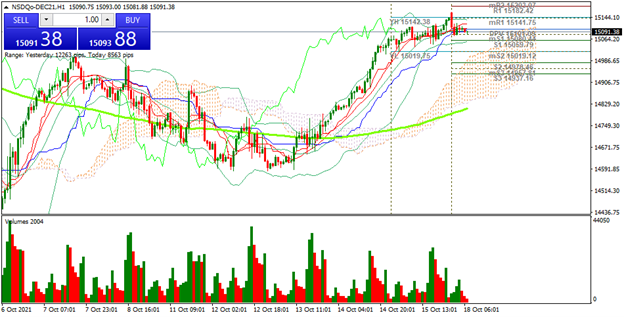 |
| Support 1: 15,083.8 Support 2: 15,093.1 Support 3: 15,099.1 Resistance 1: 15,114.4 Resistance 2: 15,123.7 Resistance 3: 15,129.7 Pivot Point: 15,108.4 |
| Despite the drop, the price remains above the 200-day moving average. Expected trading range between 15,099 and 15,129. Pivot point for trend change at 15,108. RSI neutral. If the trend changes, the price could look for the level of 15,371. |
| WTI +1.42% |
| Energy price and demand for crude oil continues to rise. As a result, the price of WTI is currently up 1.42% and is trading at USD$82.89 per barrel. On the other hand, the energy crisis has generated strategic movements at a global level. In the UK, thermal coal production have returned. China is looking to close a long-term LNG supply agreement with the United States. Gazprom is looking to supply gas to Europe. Thus, demand continues to increase and traders are looking to hold positions for the winter. |
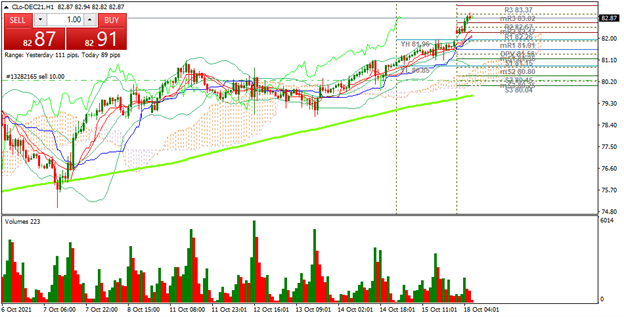 |
| Support 1: 82.79 Support 2: 82.68 Support 3: 82.52 Resistance 1: 83.06 Resistance 2: 83.22 Resistance 3: 83.33 Pivot Point: 82.95 |
| The price remains above the 200-day moving average. Expected trading range between USD$82.52 and USD$83.33. Pivot point for trend change at USD$82.95. RSI in overbought zone, which could lead to a pullback to the area of USD$81.10. |
| GOLD +0.01% |
| Markets are presenting mixed movements globally, and gold is starting to show sideways movement. The price of gold reached the level of USD$1,798, before falling to the current zone of USD$1,768 per Troy ounce. The decline was due to the rally in equities at the end of last week. Another factor affecting the price of gold is the logistical and supply chain problems that are occurring worldwide, which delays the physical delivery of gold to importing countries. On the other hand, if China’s slower growth affects equities, gold could change its trend. |
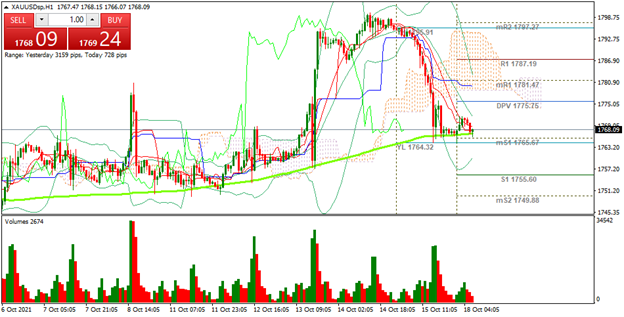 |
| Support 1: 1,767.06 Support 2: 1,765.88 Support 3: 1,765.01 Resistance 1: 1,769.11 Resistance 2: 1,769.98 Resistance 3: 1,771.16 Pivot Point: 1,767.93 |
| The price is at the same level of the 200-day moving average. At this moment, it is close to support 1. If the price changes trend, the rebound could occur towards the resistance level 1 and 2. Trading range between USD$1,765 and USD$1,771. Pivot point at USD$1,767. RSI near the oversold zone. |
| Sources |
| Reuters Market watch Bloomberg Capitalix Market Research |
Risk Disclaimer
Any information/articles/materials/content provided by Capitalix or displayed on its website is intended to be used for educational purposes only and does not constitute investment advice or a consultation on how the client should trade.
Although Capitalix has ensured that the content of such information is accurate, it is not responsible for any omission/error/miscalculation and cannot guarantee the accuracy of any material or any information contained herein.
Therefore, any reliance you place on such material is strictly at your own risk. Please note that the responsibility for using or relying on such material rests with the client and Capitalix accepts no liability for any loss or damage, including without limitation, any loss of profit which may arise directly or indirectly from the use of or reliance on such information.
Risk Warning: Forex/CFDs trading involves significant risk to your invested capital. Please read and make sure that you fully understand our Risk Disclosure Policy.
You should ensure that, depending on your country of residence, you are allowed to trade Capitalix.com products. Please ensure that you are familiar with the company’s risk disclosure.