Daily review for November 12, 2021
Global stock indexes are starting to turn positive due to the agreement between the United States and China on the use of coal and the path towards the use of alternative energies.
The crypto bulls are looking for the Bitcoin rebound, to put the price at USD$75,000. For the time being, the market is moving sideways awaiting further volatility.
WTI and industrial commodities correct at the moment. The United States plans to release part of its strategic reserves to the market to cover demand.
Metals give up a few points as traders take profits from the week’s rally. The trend continues upward due to inflation.
| DOW JONES +0.11% |
| The COP26 agreements are starting to be shown. This time, between the United States and China, where both countries agreed to reduce coal consumption and accelerate the transition to alternative energy sources. This has generated optimism in the markets, where stock market futures in Asia and Wall Street are in positive territory. At this moment, the Dow Jones is up 0.80% and is trading at 35,960. On the other hand, traders are paying close attention to AstraZeneca’s financial results. |
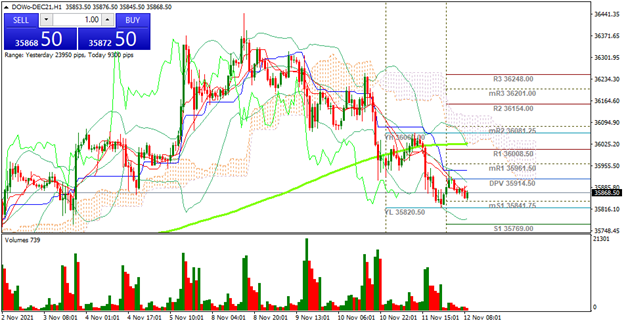 |
| Support 1: 35,936.1 Support 2: 35,919.3 Support 3: 35,895.6 Resistance 1: 35,976.6 Resistance 2: 36,000.3 Resistance 3: 36,017.1 Pivot Point: 35,959.8 |
| The index is below the 200-day moving average. The Ichimoku cloud projects a trading range between 35,914 and 36,094. Pivot point for trend change at 35,959. RSI neutral. |
| BITCOIN -0.68% |
| Bitcoin and the crypto market are trending sideways, waiting for more volatility in the market. Bitcoin is currently down 0.68% and is trading at USD$64,356. Ethereum is trying to recover the uptrend, moving up 0.46% and trading at USD$4,705. The most optimistic project the price of Bitcoin at USD$90,000 for end year. |
 |
| Support 1: 64,340.0 Support 2: 64,219.9 Support 3: 63,979.7 Resistance 1: 64,700.2 Resistance 2: 64,940.3 Resistance 3: 65,060.4 Pivot Point: 64,580.1 |
| Price is slightly above the 200-day moving average. Sideways movement above the pivot point and support 1 zone. Possible breakout of the zone, depending on market volume. RSI neutral.v |
| WTI -0.80% |
| Industrial commodities are correcting at the moment. The energy segment is correcting due to the agreement between China and the United States. WTI is currently down 0.80% and is trading at USD$80.94 per barrel. Brent is down 0.82% and is trading at USD$82.19 per barrel. Natural Gas is down 1.55%. Traders are looking for the best momentum to re-enter into the commodities market. For the moment, the focus remains on the impact of inflation on equities. |
 |
| Support 1: 80.90 Support 2: 80.79 Support 3: 80.70 Resistance 1: 81.10 Resistance 2: 81.19 Resistance 3: 81.30 Pivot Point: 80.99 |
| Expected trading range between USD$80.70 and USD$81.30. Pivot point for trend change at USD$80.99. RSI neutral. The price continues below the 200-day moving average and is approaching support 1 and 2, where it would mark an important floor. |
| SILVER -0.03% |
| Metals are starting to correct some points, as traders begin to take profits after the week’s rally. However, analysts see an upward trend, mainly due to the impact of inflation and central banks’ strategies to contain it. At the moment, the price of silver is down 0.03% and is trading at USD$25.29 per Troy ounce. The price of gold is down 0.25% and is trading at USD$1,859 per Troy ounce. In the fixed income market, the yield curve is flattening. |
 |
| Support 1: 25.286 Support 2: 25.252 Support 3: 25.216 Resistance 1: 25.356 Resistance 2: 25.392 Resistance 3: 25.426 Pivot Point: 25.322 |
| The price is above the 200-day moving average. Expected trading range between USD$25.21 and USD$25.42. Pivot point for trend change at USD$25.32. RSI leaving the overbought zone. |
| Sources |
| Reuters Market watch Bloomberg Capitalix Market Research |
Risk Disclaimer
Any information/articles/materials/content provided by Capitalix or displayed on its website is intended to be used for educational purposes only and does not constitute investment advice or a consultation on how the client should trade.
Although Capitalix has ensured that the content of such information is accurate, it is not responsible for any omission/error/miscalculation and cannot guarantee the accuracy of any material or any information contained herein.
Therefore, any reliance you place on such material is strictly at your own risk. Please note that the responsibility for using or relying on such material rests with the client and Capitalix accepts no liability for any loss or damage, including without limitation, any loss of profit which may arise directly or indirectly from the use of or reliance on such information.
Risk Warning: Forex/CFDs trading involves significant risk to your invested capital. Please read and make sure that you fully understand our Risk Disclosure Policy.
You should ensure that, depending on your country of residence, you are allowed to trade Capitalix.com products. Please ensure that you are familiar with the company’s risk disclosure.