Daily Review for May 26, 2021
Traders are following US infrastructure plan. For the moment, inflation concerns are on the back seat.
European markets open higher and the EuroStoxx50 seeks to consolidate above 4,000 points.
The District of Columbia sued Amazon for corporate malpractice. Possible pressure on the Nasdaq 100.
US Crude oil reserves have declined. Today inventories data will be released. At the moment the price is close to USD$70 per barrel. Goldman Sachs forecasts the price at USD$80.
Gold reached USD$1,900 per Troy ounce. The Bulls are looking to consolidate this zone. The metal remains at investors’ portfolios.
| EURO STOXX 50 +0.30% |
| Market opens positive in Europe, driven by the infrastructure program in the US, which in its execution, could bring important business for the companies that compose the Euro Stoxx 50 index. Meanwhile, the index is up 0.30% and is trading at 4,032 points. At yesterday market close, main movements were in VW +1.97%, Deutsche Post +2.59% and Adyen +2.37%. main decliners were Total -1.82%, Safran -1.81% and Munich Re -1.41%. |
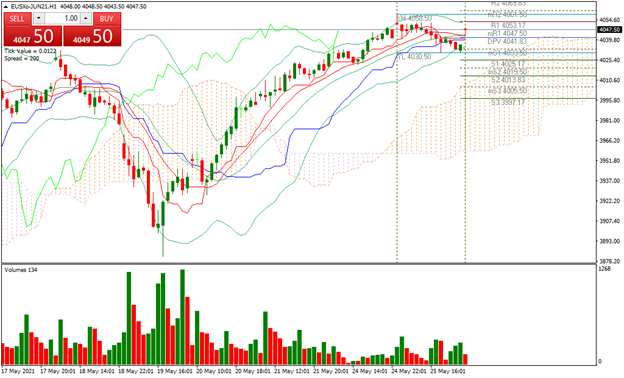 |
| Support 1: 4,048 Support 2: 4,046 Support 3: 4,044 Resistance 1: 4,052 Resistance 2: 4,054 Resistance 3: 4,056 Pivot Point: 4,050 |
| Index is above 4,000 points and above the Ichimoku cloud. Bullish trend. RSI approaching overbought zone. The price is below the 14-day moving average. Trading range between 4,044 and 4,056. Pivot point at 4,050. |
| NASDAQ 100 +0.41% |
| Nasdaq 100 index could have pressure today due to the lawsuit from the U.S. District of Columbia against Amazon. The basis of the lawsuit is corporate malpractice and price manipulation. The company’s share closed yesterday with a gain of 0.43%. The Nasdaq 100 is up 0.41%, and traders are keeping an eye on Biden’s infrastructure plan. |
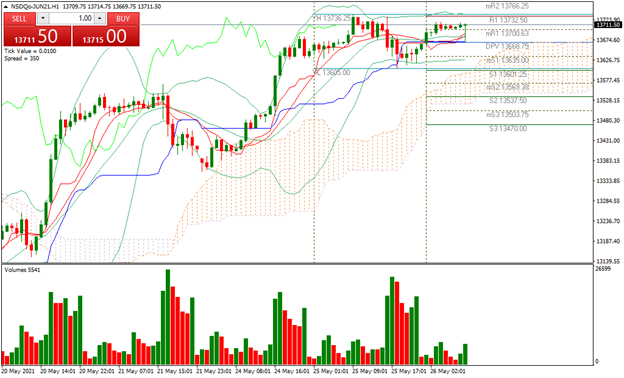 |
| Support 1: 13,706.08 Support 2: 13,700.04 Support 3: 13,693.83 Resistance 1: 13,718.33 Resistance 2: 13,724.54 Resistance 3: 13,730.58 Pivot Point: 13,712.29 |
| Price is between resistance 1 and pivot point level. Possible trend reversal. Expected trading range between 13,693 and 13,730 points. Pivot point at 13.712. RSI neutral. Possible move towards resistance 2. Otherwise, possible double top. |
| CRUDE OIL +0.48% |
| According to API, the weekly crude oil reserves in the US decreased -0.439 million barrels vs -1.27 million expected by the market. Possible increase of stocks is due to the return to normal operation of the Colonial pipeline. Today, analysts estimate a decrease in crude inventories of -1.50 million barrels, which could lead to an upward price movement. Goldman Sachs economists estimate the price of crude oil at USD$80 per barrel by the end of the year. On the other hand, it is likely that the sanctions on Iran will be removed, which would increase the supply in the market. |
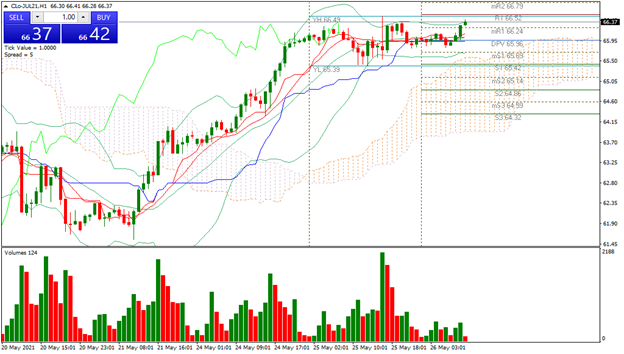 |
| Support 1: 66.05 Support 2: 65.87 Support 3: 65.77 Resistance 1: 66.33 Resistance 2: 66.43 Resistance 3: 66.61 Pivot Point: 66.15 |
| The price is between resistance 1 and 2. Ichimou cloud forecasts a trading range between 65.95 and 65.05. Pivot point at 66.15. RSI neutral, near the overbought level. |
| GOLD +0.44% |
| Gold price reached USD$1,900 per Troy ounce. The challenge now for the Bulls is to consolidate this zone, mainly because the inflation heat is dissipating. At the moment the price is up 0.44% and is trading at USD$1,905.19. Due to the extreme volatility of cryptos, investors have opted to hold gold and silver in their portfolios, in part to mitigate market uncertainty and inflation. |
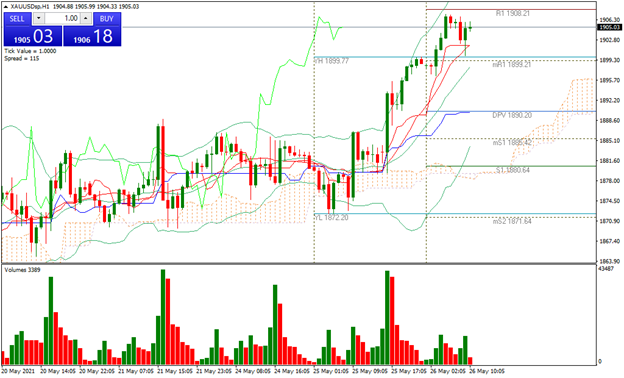 |
| Support 1: 1.902,90 Support 2: 1.899,15 Support 3: 1.896,95 Resistance 1: 1.908,85 Resistance 2: 1.911,05 Resistance 3: 1.914,80 Pivot Point: 1.905,10 |
| Estimated trading range between 1,896 and 1,914. Pivot point for trend change at 1,905. RSI in overbought zone. Possible pullback to 1,897. |
| Sources |
| Reuters Market watch Bloomberg Capitalix Market Research |
Risk Disclaimer
Any information/articles/materials/content provided by Capitalix or displayed on its website is intended to be used for educational purposes only and does not constitute investment advice or a consultation on how the client should trade.
Although Capitalix has ensured that the content of such information is accurate, it is not responsible for any omission/error/miscalculation and cannot guarantee the accuracy of any material or any information contained herein.
Therefore, any reliance you place on such material is strictly at your own risk. Please note that the responsibility for using or relying on such material rests with the client and Capitalix accepts no liability for any loss or damage, including without limitation, any loss of profit which may arise directly or indirectly from the use of or reliance on such information.
Risk Warning: Forex/CFDs trading involves significant risk to your invested capital. Please read and make sure that you fully understand our Risk Disclosure Policy.
You should ensure that, depending on your country of residence, you are allowed to trade Capitalix.com products. Please ensure that you are familiar with the company’s risk disclosure.