Daily Review for May 10, 2022
The market is trying to recover after yesterday’s crash. Almost all equity assets, stocks, commodities, indices, cryptos, ETF’s, among others, fell sharply as a result of the market panic.
Stock market crash in cryptos. Bitcoin is at its lowest level in 2022 and has lost more than 50% of its historical highs. Buying opportunity?
Major drop also in the crude oil market. Prices fell from USD$110 to the level of USD$100 per barrel.
Panicked investors began to sell most of their financial assets. Opportunity for gold and silver.
| NASDAQ 100 +1.54% |
| The market is trying to recover after yesterday’s crash. Almost all equity assets, stocks, commodities, indices, cryptos, ETF’s, among others, fell sharply as a result of the market panic due to rising interest rates, stagflation and the war in Ukraine. The Nasdaq 100 closed with a fall of 2.73%, which indicates that we are in a bear market. The index is at the same level as in 2020. It is currently trying to rebound, rising 1.54%. |
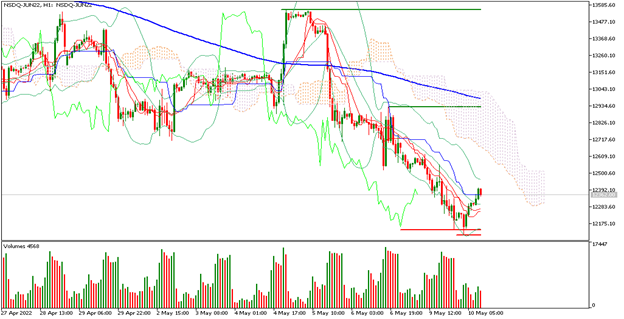 |
| Support 1: 12,348.4 Support 2: 12,299.5 Support 3: 12,270.7 Resistance 1: 12,426.1 Resistance 2: 12,454.9 Resistance 3: 12,503.8 Pivot Point: 12,377.2 |
| The index is below the 200-day moving average trying to bounce from support 3. Expected trading range between 12,270 and 12,503. Pivot point for trend reversal at 12,377. Traders have been buying cautiously at support 3 expecting a possible bounce today. |
| BITCOIN -4.94% |
| Stock market crash in cryptos. Bitcoin is at its lowest level in 2022 and has lost more than 50% of its all-time highs. Panic by retail investors, who have generated a drop to support 2 at USD$29,646. Bitcoin closed yesterday with a drop of 11.52%. Traders are looking for an interesting rebound from this area. At the moment the Bitcoin is down 4.94% and is trading at USD$31,836. The crypto has fallen to 2021 levels, with new support levels in the USD$28,000 area. |
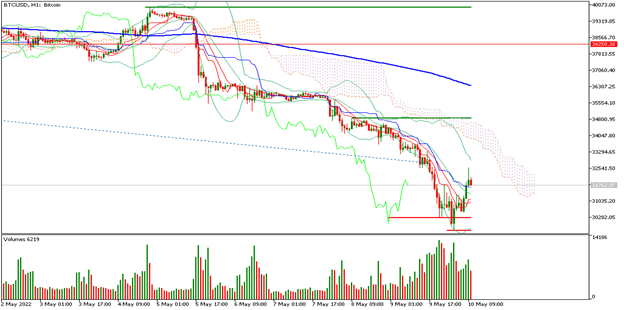 |
| Support 1: 31,769.6 Support 2: 31,402.3 Support 3: 30,946.6 Resistance 1: 32,592.6 Resistance 2: 33,048.3 Resistance 3: 33,415.6 Pivot Point: 32,225.3 |
| The price is below the 200-day moving average, which is a bearish signal for Bitcoin. Expected trading range between USD$30,946 and USD$33,415. Pivot point for trend change at USD$32.225. RSI neutral, so the selling volume could start again until the best buying level. |
| WTI +0.26% |
| A significant drop also in the crude oil market. Prices fell from USD$110 to the level of USD$100 per barrel. The price is trying to rebound and remains slightly above USD$100 per barrel. Traders are paying attention to the weekly US reserves report, which is expected to show a 3.4 million barrels reduction due to an increase in exports of the commodity to Europe in order to replace Russia as a origin. Analysts expect greater volatility during the year due to the rise in interest rates and the war in Ukraine. |
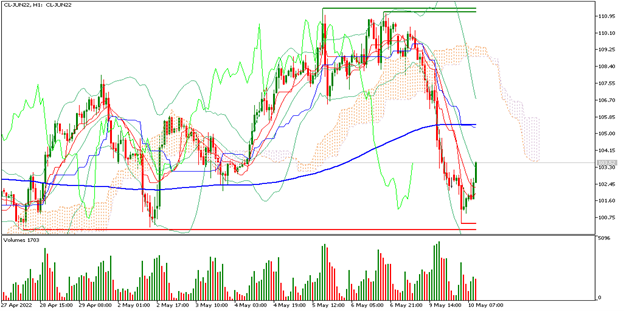 |
| Support 1: 101.91 Support 2: 101.27 Support 3: 100.84 Resistance 1: 102.98 Resistance 2: 103.41 Resistance 3: 104.05 Pivot Point: 102.34 |
| The price is below the 200-day moving average. Expected trading range between USD$100.84 and USD$104.05. Pivot point for trend change at USD$102.34. RSI neutral, so the rebound could occur towards the resistance line 1. |
| GOLD +0.02% |
| Panic investors started to sell most of their financial assets. Today, there is a significant volume of purchases in gold and silver, since they are considered the traditional assets to hedge the risk of volatility in the market. Gold is currently up 0.02% and is trading at USD$1,859 per Troy ounce. Analysts expect a rebound towards USD$2,000 per Troy ounce, derived from the fear in the market about equities. |
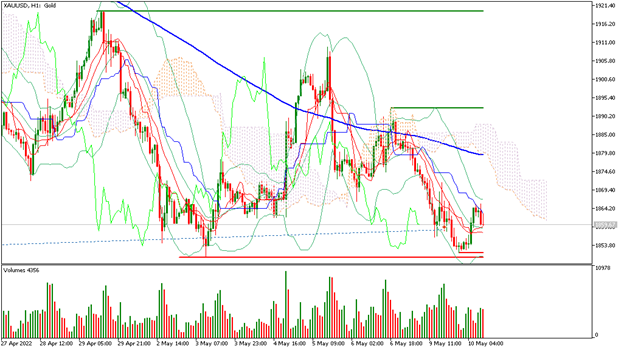 |
| Support 1: 1,857.00 Support 2: 1,854.91 Support 3: 1,851.11 Resistance 1: 1,862.89 Resistance 2: 1,866.69 Resistance 3: 1,868.78 Pivot Point: 1,860.80 |
| Price is below the 200-day moving average, leaving support 2. Expected trading range between USD$1,851 and USD$1,868. Pivot point for trend change at USD$1,860. RSI neutral, so the price could start to bounce towards the resistance zones. |
| Sources |
| Reuters Market watch Bloomberg Capitalix Market Research |
Risk Disclaimer
Any information/articles/materials/content provided by Capitalix or displayed on its website is intended to be used for educational purposes only and does not constitute investment advice or a consultation on how the client should trade.
Although Capitalix has ensured that the content of such information is accurate, it is not responsible for any omission/error/miscalculation and cannot guarantee the accuracy of any material or any information contained herein.
Therefore, any reliance you place on such material is strictly at your own risk. Please note that the responsibility for using or relying on such material rests with the client and Capitalix accepts no liability for any loss or damage, including without limitation, any loss of profit which may arise directly or indirectly from the use of or reliance on such information.
Risk Warning: Forex/CFDs trading involves significant risk to your invested capital. Please read and make sure that you fully understand our Risk Disclosure Policy.
You should ensure that, depending on your country of residence, you are allowed to trade Capitalix.com products. Please ensure that you are familiar with the company’s risk disclosure.