Daily Review for March 31, 2021
Gold prices remain under pressure mainly due to US long-term bond yields and the USD appreciation against G8 currencies.
Crude oil price into sideway as the market gets the conclusions of the OPEC+ meeting.
Portafolios Allocation moves around industrial companies and with it the Nasdaq 100 price is impacted.
DAX 30 at all-time highs. FTSE100 in red due to the 8% GDP contraction of the British economy in 2020.
Important macroeconomic data for today, CPI in the Euro Zone, unemployment change in Germany, ADP in the USA and IEA crude oil inventories.
| GOLD -0.11% |
| Gold prices remained in a downtrend during the Asian session. At the moment the price remains above support 1 at USD$1,686.76. US long term bond yields continue to rise. As well as the USD against several G8 currencies. This has put pressure on gold, so the downtrend continues. Yesterday the 1,700 support was broken. |
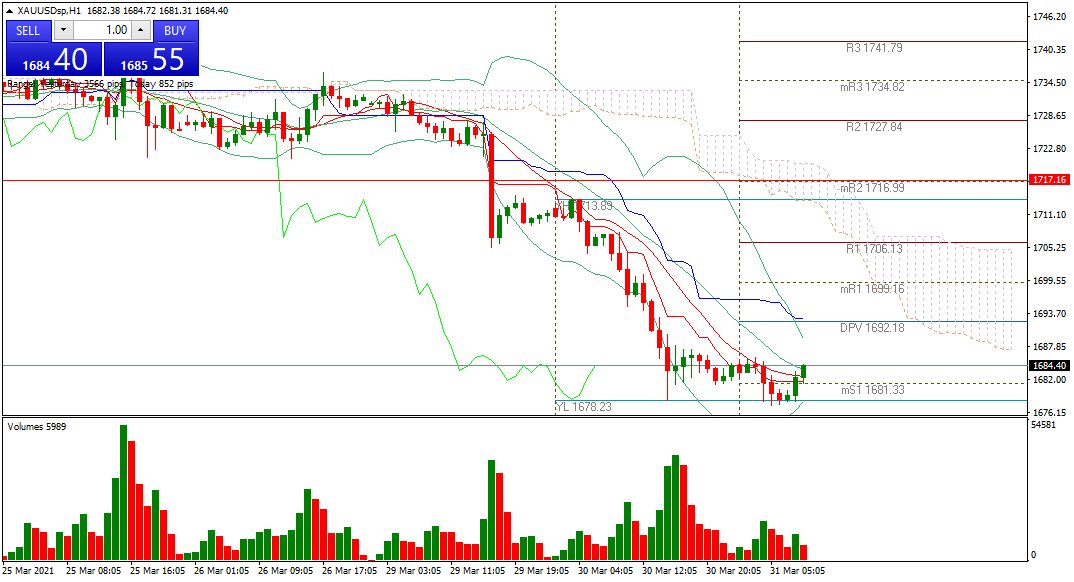 |
| Support 1: 1,673.1 Support 2: 1,661.05 Support 3: 1,631.25 Resistance 1: 1,702.9 Resistance 2: 1,720.65 Resistance 3: 1,750.45 Pivot Point: 1,690.85 |
| Bulls are trying to drive the price towards resistance 1 in order to regain the 1,700 level. Previously they have succeeded in doing so. Trading range between 1,631 and 1,750. Pivot point at 1,690. Possible move towards 1,700. Shorts towards 1,650. |
| CRUDE OIL +0.69% |
| Volume of crude oil contracts sold on the Chicago Mercantile Exchange has increased and caused the price to fall after reaching the level of 64 per barrel. At the moment, the price is above the Ichimoku cloud, which suggests that the price will enter a consolidation phase while the market awaits the OPEC+ decision. The organization will hold a meeting tomorrow, where they will analyze their demand estimate. Analysts expect that they will modify it taking into account the factor that vaccines are not going at the desired pace, and therefore the industry will not return to pre-covid growth levels as quickly as expected. Today we will have the IEA inventories report (est. 0.107M). |
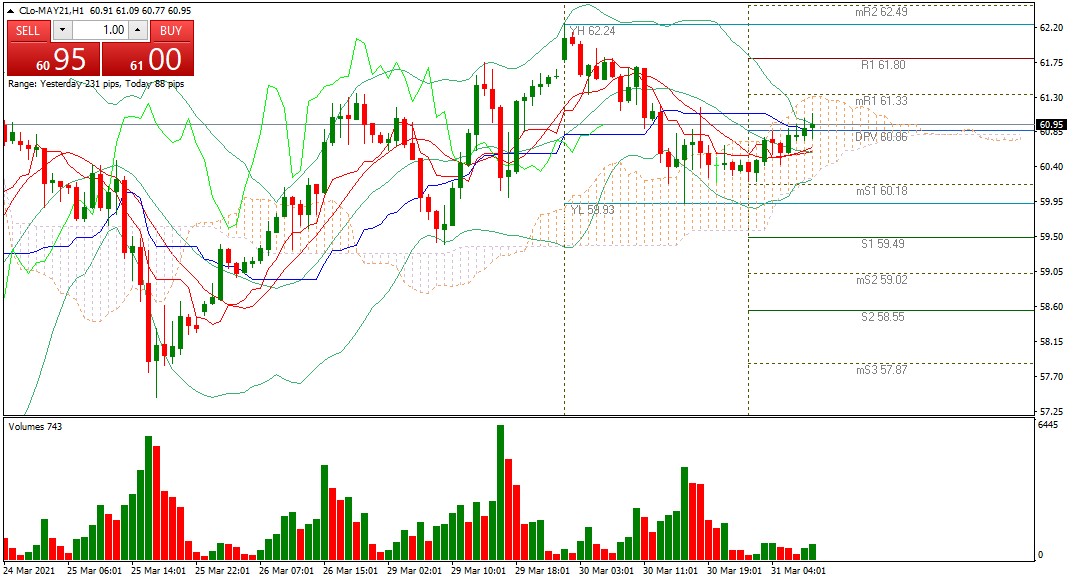 |
| Support 1: 59,63 Support 2: 58,86 Support 3: 57,01 Resistance 1: 61,49 Resistance 2: 62,57 Resistance 3: 64,42 Pivot Point: 60,72 |
| Sideways movement above 60.92. Bulls are looking for the 62 level, based on additional OPEC+ production cuts. Bears look for 59, based on demand contraction. Trading range between 57 and 64. Pivot point at 60.72. |
| NASDAQ 100 +0.01% |
| The US technology index is in a period of consolidation as investors define their appetite for the sector. During this week, the Dow Jones reached record highs, demonstrating that the new portfolio allocation is composed of industrial and less technological companies. This has punished the price of the Nasdaq 100, which has shown significant declines during February and March 2021. Today, traders are aware of Biden and the anti covid program as well as the ADP report on non-farm employment change in the US (est.+550,000). |
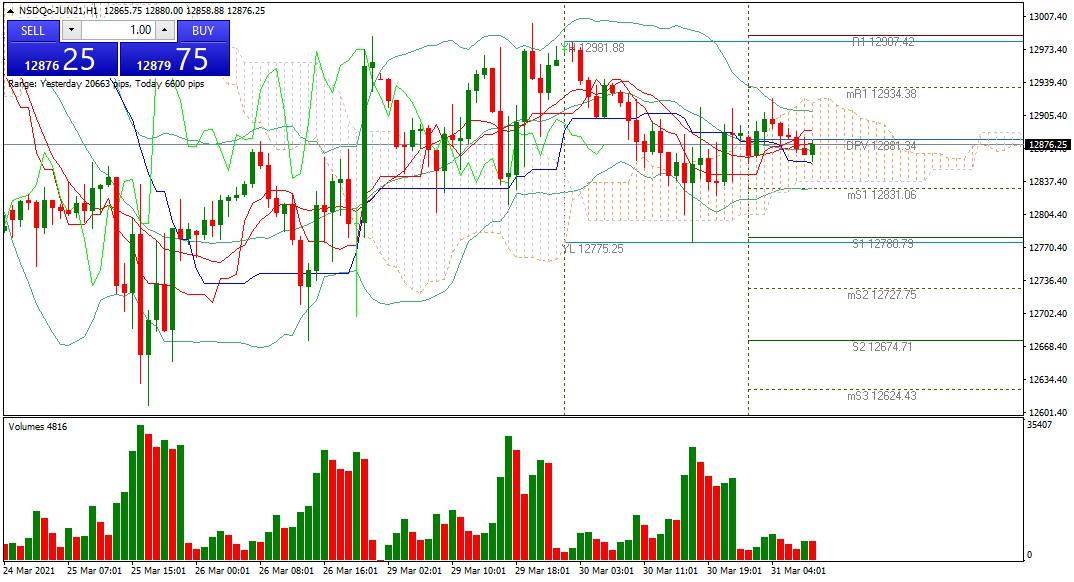 |
| Support 1: 12,865.96 Support 2: 12,858.05 Support 3: 12,848.72 Resistance 1: 12,883.20 Resistance 2: 12,892.53 Resistance 3: 12,900.44 Pivot Point: 12,875.29 |
| The price is at the Ichimoku cloud, which estimates sideways movements. Price has failed to approach the 13,000 resistance. Bears are looking for the 12,500 zone, while the Bulls are looking for resistance 1. Pivot point at 12,875. RSI neutral. |
| DAX30 +0.05% |
| The German index managed to reach 15,000 points. Industrial companies are gaining positions in investors’ portfolios that have generated enough buying volume for the DAX30 to overcome the resistance of 15,000 points. Meanwhile, the stock market in Europe opened mixed, with declines in the FTSE 100 due to the contraction of the British economy by 8% in 2020. Today we will have the report on the change in unemployment in Germany (est. -3,000) and the Euro Zone CPI (est.1.3%). |
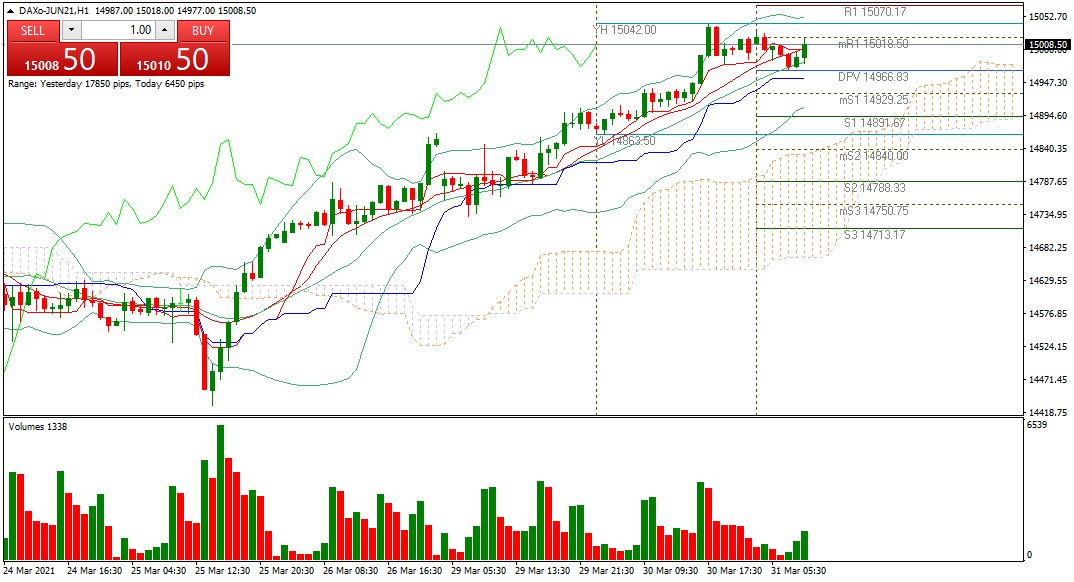 |
| Support 1: 14.975,9 Support 2: 14.963,2 Support 3: 14.953,9 Resistance 1: 14.997,9 Resistance 2: 15.007,2 Resistance 3: 15.019,9 Pivot Point: 14.985,2 |
| Bullish trend. Price overcame the resistance 1 and is at the level of 15,070. RSI is near the overbought level. Trading range between 14.953 and 15.020. Pivot point at 14.985. |
Risk Disclaimer
Any information/articles/materials/content provided by Capitalix or displayed on its website is intended to be used for educational purposes only and does not constitute investment advice or a consultation on how the client should trade.
Although Capitalix has ensured that the content of such information is accurate, it is not responsible for any omission/error/miscalculation and cannot guarantee the accuracy of any material or any information contained herein.
Therefore, any reliance you place on such material is strictly at your own risk. Please note that the responsibility for using or relying on such material rests with the client and Capitalix accepts no liability for any loss or damage, including without limitation, any loss of profit which may arise directly or indirectly from the use of or reliance on such information.
Risk Warning: Forex/CFDs trading involves significant risk to your invested capital. Please read and make sure that you fully understand our Risk Disclosure Policy.
You should ensure that, depending on your country of residence, you are allowed to trade Capitalix.com products. Please ensure that you are familiar with the company’s risk disclosure.