Daily Review for March 29, 2021
The early return to normalcy of the Suez Canal affects the price of crude oil, since all the oil tankers that were detained will return to the market and traders begin to sell at a discount to liquidate their physical holdings of the commodity.
Market open mixed. Wall Street futures are in red due to the breach of the Margin Call by the hedge fund Archegon.
German sentiment indicator, the IFO, showed a glimpse of business optimism.
Volatility is expected this week. Friday is holiday, so the market is likely to anticipate the effect of the NFP.
Possible rebound in Gold on sell-off in equities.
Wall Street futures in red. Nomura and Credit Suisse as Archegon debt holders in alarm over possible default of the company.
| CRUDE OIL -1.95% |
| Crude oil prices start this week in negative territory as a result of the pressure of covid-19 in the market. The price is currently down 1.95% and is trading at USD$59.80 per barrel. In the Suez Canal, the logistics operation could soon resume as the Evergreen cargo vessel is released. During this week, traders are looking forward to the OPEC+ meeting to be held on Thursday, where they will discuss whether or not to extend crude oil production cuts. |
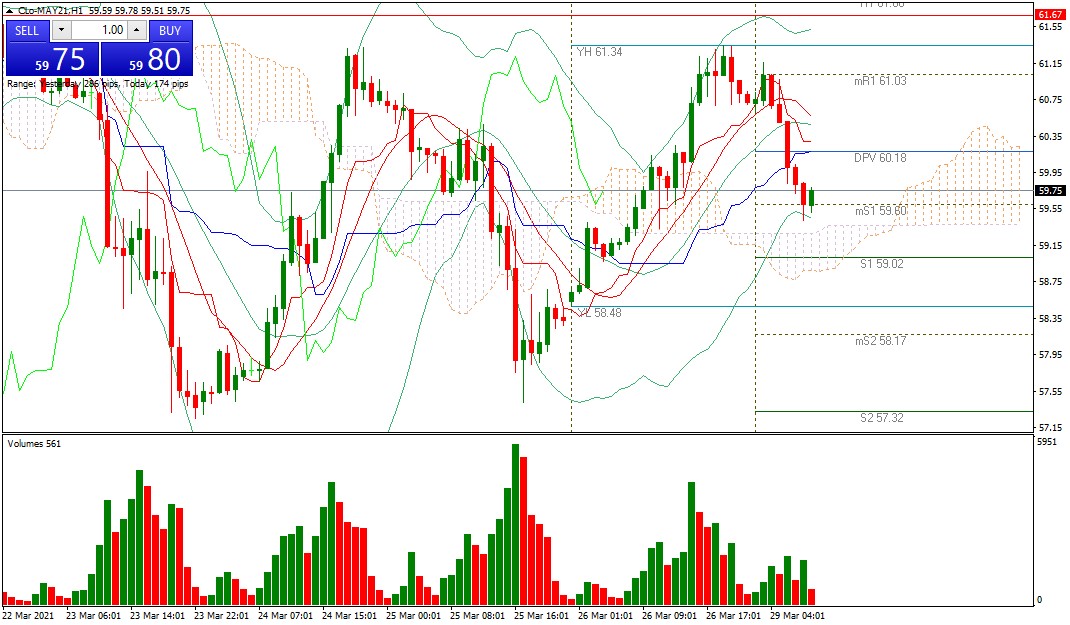 |
| Support 1: 59.37 Support 2: 59.19 Support 3: 58.94 Resistance 1: 59.80 Resistance 2: 60.05 Resistance 3: 60.23 Pivot Point: 59.62 |
| The price is at the 25-day and 50-day moving average. It was previously in a reverse shoulder head shoulder formation which ended at the 61.34 resistance. Price could take a sideways move towards 60.35. Pivot point at 59.62. |
| DAX 30 -0.42% |
| According to Germany’s IFO Sentiment Indicator, businessmen’s expectations on economic growth are high, as the number of business deals with the Asian market is increasing. Therefore, the market could show a bullish opening of the DAX 30. In Europe, a mixed opening of the market is expected, with interesting volatilities for the development of the week. Fear of a fourth wave of covid-19 in Europe continues to rise. |
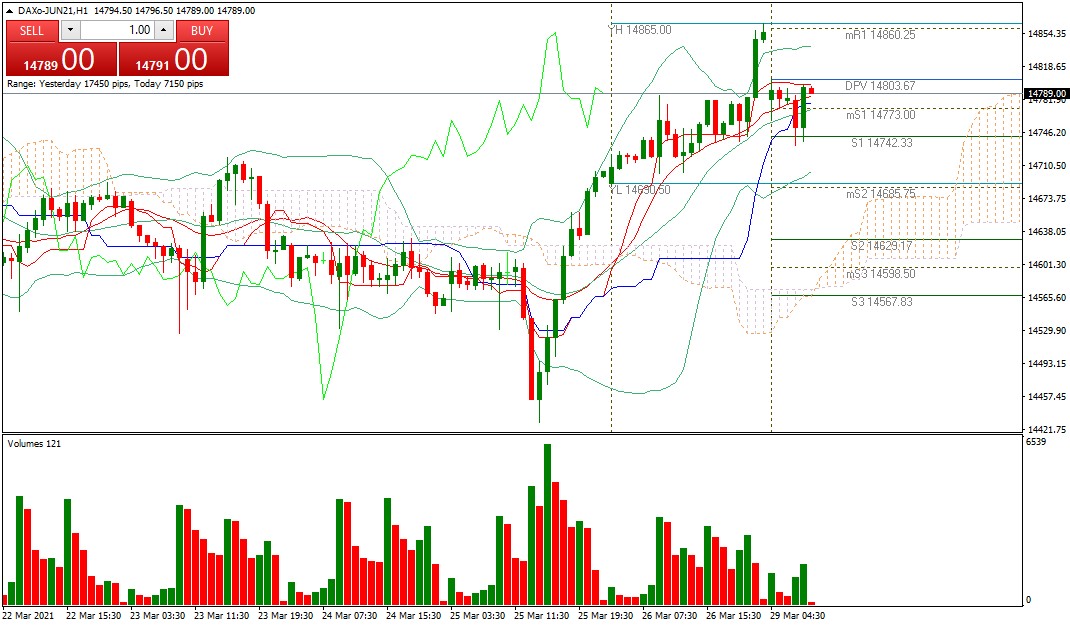 |
| Support 1: 14,737.4 Support 2: 14,709.2 Support 3: 14,684.9 Resistance 1: 14,789.9 Resistance 2: 14,814.2 Resistance 3: 14,842.4 Pivot Point: 14,761.7 |
| Bullish outlook. Price is above support 1. If the market opens with bullish strength, the price could go to the level of 14,860. The next level of the Bulls is 15,000. Trading range between 14,684 and 14,842. Pivot point at 14,761. |
| GOLD -0.32% |
| Trading week starts mixed, and traders anticipate high volatility in the equities market as a result of the massive sell-off in technology stocks that took place last Friday in companies listed on the Nasdaq. This could be a bullish opportunity for gold. The metal is currently down 0.32% and is trading at USD$1,726 per Troy ounce. On Tuesday we will have the sentiment indicator from The Conference Board in the US and on Friday we will have the NFP. Due to Friday holiday the market is expected to anticipate NFP volatility. |
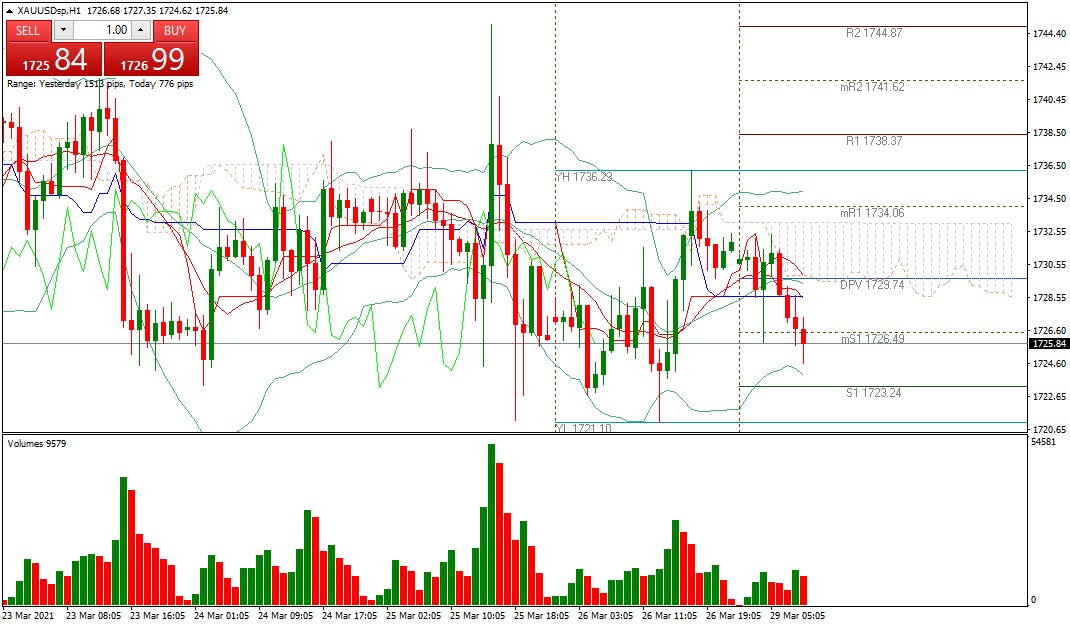 |
| Support 1: 1,727.29 Support 2: 1,725.52 Support 3: 1,724.34 Resistance 1: 1,730.24 Resistance 2: 1,731.42 Resistance 3: 1,733.19 Pivot Point: 1,728.47 |
| Price is above support 1. The Ichimoku cloud forectas the price above 1,732. If the sell-off in technology stocks continues, we could see price above resistance 2 and 3. Pivot Point at 1.728. |
| NASDAQ 100 -0.50% |
| Significant selling volume occurred last Friday, driven by Goldman Sachs and the liquidation it generated over the Chinese hedge fund Archegos. The liquidation took place due to Archegon missed margin call. Meanwhile, Nasdaq continues in negative territory, falling 0.50%. The S&P500 and the Dow Jones are also in red. The liquidation of the securities held by Archegon is affecting the fund’s debt holders, Nomura and Credit Suisse mainly. The risk of default of the company is high. |
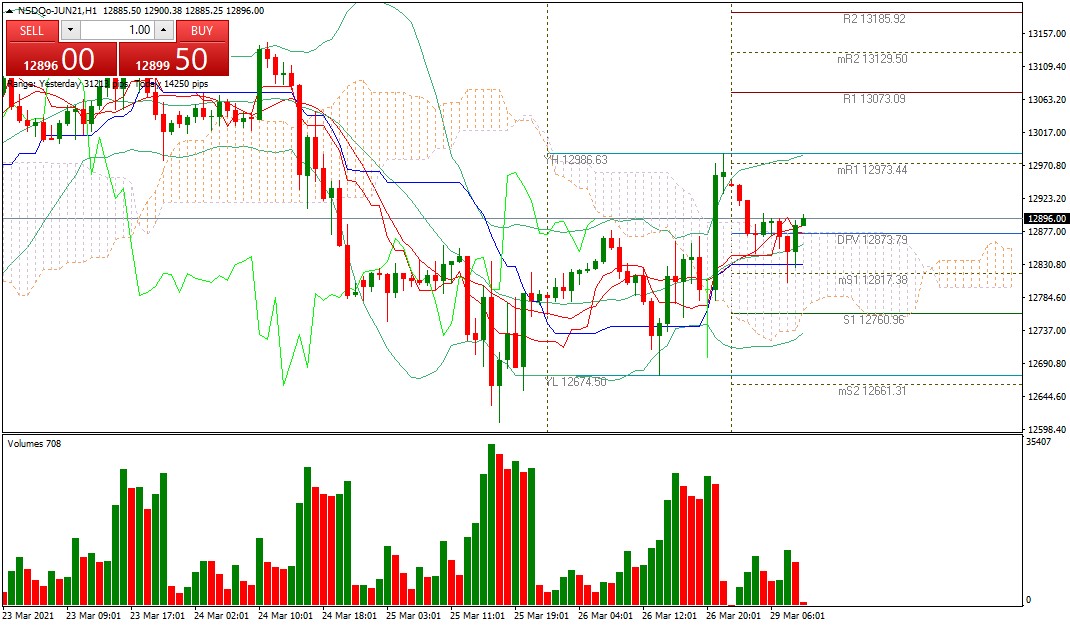 |
| Support 1: 12,842.59 Support 2: 12,803.42 Support 3: 12,777.59 Resistance 1: 12,907.59 Resistance 2: 12,933.42 Resistance 3: 12,972.59 Pivot Point: 12,868.42 |
| Price is approaching resistance 1. If it breaks this level, the next target is 12,933. Possible sideways, as long as the market marks a trend. RSI neutral, coming out of the oversold zone. Trading range between 12.777 and 12.972. Pivot point at 12.868. |
Risk Disclaimer
Any information/articles/materials/content provided by Capitalix or displayed on its website is intended to be used for educational purposes only and does not constitute investment advice or a consultation on how the client should trade.
Although Capitalix has ensured that the content of such information is accurate, it is not responsible for any omission/error/miscalculation and cannot guarantee the accuracy of any material or any information contained herein.
Therefore, any reliance you place on such material is strictly at your own risk. Please note that the responsibility for using or relying on such material rests with the client and Capitalix accepts no liability for any loss or damage, including without limitation, any loss of profit which may arise directly or indirectly from the use of or reliance on such information.
Risk Warning: Forex/CFDs trading involves significant risk to your invested capital. Please read and make sure that you fully understand our Risk Disclosure Policy.
You should ensure that, depending on your country of residence, you are allowed to trade Capitalix.com products. Please ensure that you are familiar with the company’s risk disclosure.