Daily Review for March 23, 2022
Gold prices remain in a sideways trend. Traders are watching the statements of the Fed and the ECB. The focus is on the volatility caused by the interest rate hike.
European stock markets open higher. European stock indices shows upward movements. European bonds and fixed income instruments correct.
Retail investors managed to push Bitcoin towards USD$43,300. Hedge funds have not entered the market for the time being. The near-term target is USD$45,500.
The energy commodity market continues to rise. The price of WTI keeps rising, due to the possible supply shock generated by the sanctions on Russia.
| GOLD -0.07% |
| Traders are once again paying close attention to Jerome Powell’s statement as Fed Chairman. The Fed’s vision continues to be to reduce inflation to the 2% per year. At the last reading in February 2022, the U.S. inflation rate was 7.9% p.a., well above the Fed’s inflation target. Therefore, the market anticipates several rate hikes during the year. On the other hand, the war in Ukraine continues, generating volatility in the market, mainly in commodities. The price of gold is currently down 0.07% and is trading at USD$1,920 per Troy ounce. |
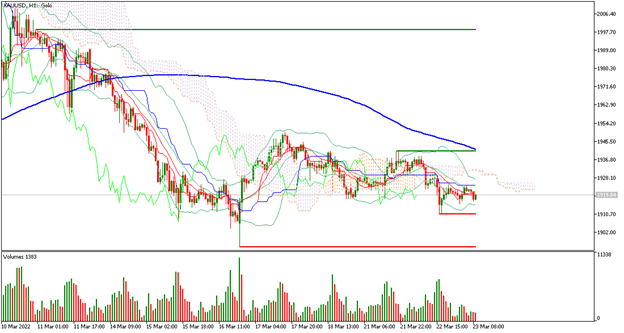 |
| Support 1: 1,916.20 Support 2: 1,914.55 Support 3: 1,911.95 Resistance 1: 1,920.45 Resistance 2: 1,923.05 Resistance 3: 1,924.70 Pivot Point: 1,918.80 |
| The price is below the 200-day moving average, presenting sideway on the support of USD$1.910. Expected trading range between USD$1,911 and USD$1,924. Pivot point for trend change at USD$1,918. RSI neutral, so the sideways trend may remain. |
| EUROSTOXX 50 +0.37% |
| European stock markets open higher, boosted by market expectations about the European Central Bank meeting. At the moment the Eurostoxx 50 is up 0.37% and is trading at 3,844. Traders are keeping an eye on the ECB and the possibility of the timing of interest rate hikes in Europe. The ECB meeting is also focused on assessing the bloc’s economic scenarios in times of conflict and post-pandemic. |
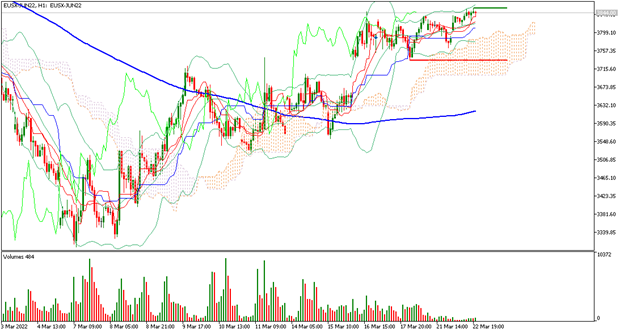 |
| Support 1: 3,842 Support 2: 3,834 Support 3: 3,823 Resistance 1: 3,861 Resistance 2: 3,872 Resistance 3: 3,880 Pivot Point: 3,853 |
| The price is above the 200-day moving average. The Ichimoku cloud projects the price towards 3,841. Bullish movement above the 3,861 resistance. If the buying volume manages to overcome the supply, the price could approach 4,000 points. Expected trading range between 3,823 and 3,880. RSI approaching the overbought zone. |
| BITCOIN -0.43% |
| The recent price momentum pushed Bitcoin towards USD$43,300, where traders started to take profit. At the moment the price is correcting 0.43% and is trading at USD$42,074. Bulls are keeping the target at USD$45,500. The momentum has been generated by retail traders, while whales and hedge funds are still staying away from the market, mainly due to increased regulation in Europe and USA. |
 |
| Support 1: 42,036.4 Support 2: 41,937.7 Support 3: 41,820.4 Resistance 1: 42,252.4 Resistance 2: 42,369.7 Resistance 3: 42,468.4 Pivot Point: 42,153.7 |
| The price remains above the 200-day moving average, which is a bullish signal for Bitcoin. Expected trading range between USD$41,820 and USD$42,468. Pivot point for trend change at USD$42,153. RSI neutral. The price is at the support line, so it could present a rebound. |
| WTI +1.07% |
| Weekly U.S. crude oil reserves decreased by 4.2 million barrels. Today, traders are watching the inventories report, where analysts expect an increase of 110,000 barrels. Meanwhile, the price maintains its upward trend, currently up 1.07% and trading at USD$110.56 per barrel. The upward trend is maintained due to the market’s fear of a supply shock from Russia derived from the sanctions. |
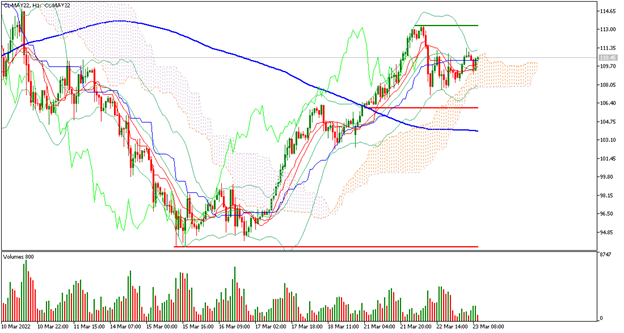 |
| Support 1: 109.65 Support 2: 108.90 Support 3: 108.49 Resistance 1: 110.81 Resistance 2: 111.22 Resistance 3: 111.97 Pivot Point: 110.06 |
| The price remains above the 200-day moving average. It is currently between the USD$113 resistance and USD$106 support. Pivot point for trend change at USD$110.06. RSI neutral. The next target for the Bulls is at USD$120 per barrel. |
| Sources |
| Reuters Market watch Bloomberg Capitalix Market Research |
Risk Disclaimer
Any information/articles/materials/content provided by Capitalix or displayed on its website is intended to be used for educational purposes only and does not constitute investment advice or a consultation on how the client should trade.
Although Capitalix has ensured that the content of such information is accurate, it is not responsible for any omission/error/miscalculation and cannot guarantee the accuracy of any material or any information contained herein.
Therefore, any reliance you place on such material is strictly at your own risk. Please note that the responsibility for using or relying on such material rests with the client and Capitalix accepts no liability for any loss or damage, including without limitation, any loss of profit which may arise directly or indirectly from the use of or reliance on such information.
Risk Warning: Forex/CFDs trading involves significant risk to your invested capital. Please read and make sure that you fully understand our Risk Disclosure Policy.
You should ensure that, depending on your country of residence, you are allowed to trade Capitalix.com products. Please ensure that you are familiar with the company’s risk disclosure.