Daily Review for March 21, 2022
The war in Ukraine continues, and with it a rise in commodity prices in the energy and agriculture segments. WTI once again overcomes the resistance of USD$100 per barrel.
European stock markets open lower due to the conflict. Traders are looking forward to the statements of the Bundesbank and Jerome Powell as chairman of the FED.
Bitcoin maintains sideways trend near USD$41,000. At the moment the crypto maintains a similar volume of supply and demand.
Gold as a safe haven asset maintains sideways trend. Traders maintain positions in the metal without generating new long positions for the moment.
| WTI +4.05% |
| After the continuation of the war in Ukraine, the price of WTI returned above USD$100 per barrel. At the moment the commodity is up 4.05% and is trading at USD$108.82 per barrel. The market is waiting for OPEC+’s strategy regarding the current price level. Analysts believe that the plan to increase production by 400,000 barrels per month continues. Meanwhile, the IEA announced a plan to cut oil use by 2.7 million barrels per day. European leaders are considering imposing sanctions on Russian oil and commodities production. |
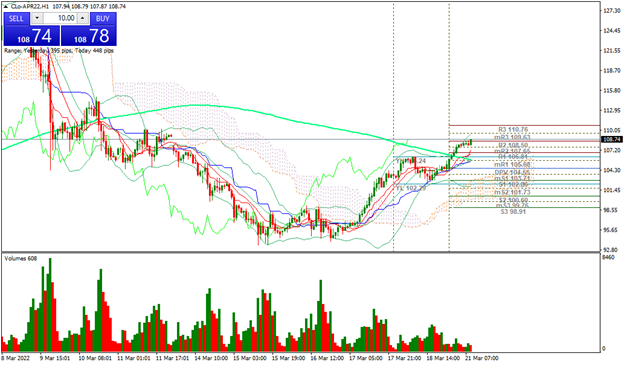 |
| Support 1: 106.09 Support 2: 105.83 Support 3: 105.39 Resistance 1: 106.79 Resistance 2: 107.23 Resistance 3: 107.49 Pivot Point: 106.53 |
| The price is at resistance 3, reaching the level of USD110.76 per barrel. Crude oil has crossed the 200-day moving average line. Expected trading range between USD$105.39 and USD$107.49. Pivot point for trend change at USD$106.53 per barrel. RSI in overbought zone. |
| EUROSTOXX 50 -0.05% |
| European stock futures are in negative territory. The war in Ukraine continues. Russia demanded the surrender of the city of Mariupol, which Ukraine denied. Traders are also watching the Bundesbank’s statement, which may give signals on monetary policy in the European Union. They are also looking forward to statements from Fed Chairman Jerome Powell, who will present the bank’s global economic outlook. |
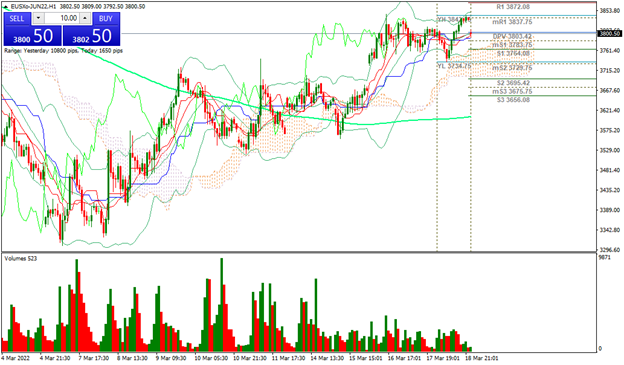 |
| Support 1: 3,794 Support 2: 3,785 Support 3: 3,780 Resistance 1: 3,808 Resistance 2: 3,808 Resistance 3: 3,822 Pivot Point: 3,799 |
| Price is between the pivot point and resistance 1. Expected trading range between 3,780 and 3,822. Pivot point for trend change at 3,799. RSI neutral. The price is above the 200-day moving average. Despite the correction, the bullish channel remains in place. |
| BITCOIN -1.54% |
| Analysts believe that the Bitcoin stopped having 4-year cycles due to its high correlation with the equity market. At the moment, analysts are evaluating the short rally of the cryptocurrency. At the moment the Bitcoin is down 1.54% and is trading at USD$41,141. There is a high volume of buying and selling, which has caused the Bitcoin to maintain a sideways trend above USD$40,900. |
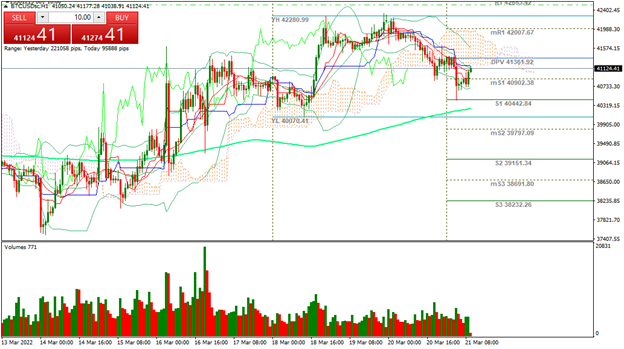 |
| Support 1: 40,881.0 Support 2: 40,666.0 Support 3: 40,546.0 Resistance 1: 41,216.0 Resistance 2: 41,336.0 Resistance 3: 41,551.0 Pivot Point: 41,001.0 |
| The price is above the 200-day moving average. Expected trading range between USD$40,546 and USD$41,551. Pivot point for trend change at USD$41,001. The price remains above the 200-day moving average, which is a bullish signal for Bitcoin. RSI neutral. |
| GOLD -0.23% |
| Gold prices remain in a sideways trend as traders assess the performance of equities. The war in Ukraine continues, and the need to hedge portfolios continues. As a result, the gold price has managed to stay above USD$1,900 per Troy ounce. If the conflict escalates, the price of gold could exceed USD$2,000 per Troy ounce. For the time being, metals are correcting, with main fall in copper with a -1.34% drop. |
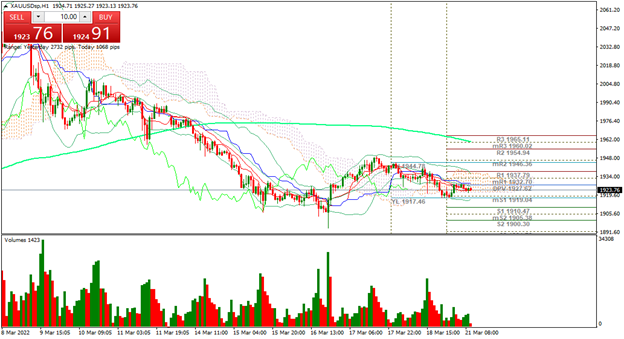 |
| Support 1: 1,922.91 Support 2: 1,920.43 Support 3: 1,918.81 Resistance 1: 1,927.01 Resistance 2: 1,928.63 Resistance 3: 1,931.11 Pivot Point: 1,924.53 |
| The price is below the 200-day moving average. Expected trading range between USD$1,918 and USD$1,931. Pivot point for trend change at USD$1,924. RSI neutral. Traders are waiting for the ECB rate announcement. This could present a new rally for the metal. |
| Sources |
| Reuters Market watch Bloomberg Capitalix Market Research |
Risk Disclaimer
Any information/articles/materials/content provided by Capitalix or displayed on its website is intended to be used for educational purposes only and does not constitute investment advice or a consultation on how the client should trade.
Although Capitalix has ensured that the content of such information is accurate, it is not responsible for any omission/error/miscalculation and cannot guarantee the accuracy of any material or any information contained herein.
Therefore, any reliance you place on such material is strictly at your own risk. Please note that the responsibility for using or relying on such material rests with the client and Capitalix accepts no liability for any loss or damage, including without limitation, any loss of profit which may arise directly or indirectly from the use of or reliance on such information.
Risk Warning: Forex/CFDs trading involves significant risk to your invested capital. Please read and make sure that you fully understand our Risk Disclosure Policy.
You should ensure that, depending on your country of residence, you are allowed to trade Capitalix.com products. Please ensure that you are familiar with the company’s risk disclosure.