Daily Review for March 14, 2022
The energy and metals markets start the week in negative territory, derived from the continuation of the war in Ukraine, which is generating problems in the world trade of raw materials.
The DAX 40 starts the week in positive territory. Traders are watching the ECB’s strategy and the Eurogroup’s progress on the military budget and energy needs.
Palladium falls more than 6% as Russia is the producer of 40% of the metal’s global production. The motor industry starts to suffer as a result of the metal being used as a component.
Cryptos start the week with mixed movements. Ethereum breaks sideways and rises 0.55%. Traders are paying attention to the vote of the European Parliament on the cryptocurrency market.
| WTI -2.77% |
| The WTI price starts the week down 2.77% and trades at USD$106.26 per barrel. Russian oil importers continue to look for new sources of supply. China, for example, started using thermal coal again to prioritize its energy security. On the other hand, LNG exports from the United States to Europe continue to increase. The war in Ukraine continues, and the commodities market shows mixed movements, with main corrections in the energy and metals segments. |
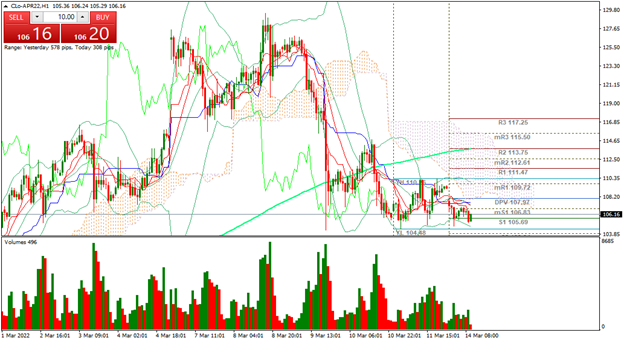 |
| Support 1: 104.86 Support 2: 104.37 Support 3: 103.52 Resistance 1: 106.20 Resistance 2: 107.05 Resistance 3: 107.54 Pivot Point: 105.71 |
| The price is below the 200-day moving average. At this moment it is at support 1, where it could continue descending towards support 2 where an important floor would be marked. Expected trading range between USD$103.52 and USD$107.54. Pivot point at USD$105.71. RSI neutral. |
| DAX 40 +1.54% |
| European stock indexes start the week with mixed movements. Traders are attentive to the ECB statement and the Eurogroup meeting. The ECB is concentrating on assessing the tapering of economic stimulus in wartime. While the Eurogroup is focused on increasing the bloc’s military budget and replacing Europe’s dependence on raw materials from Russia. At the moment, the DAX 40 is up 1.54% and is trading at 13,872 points. |
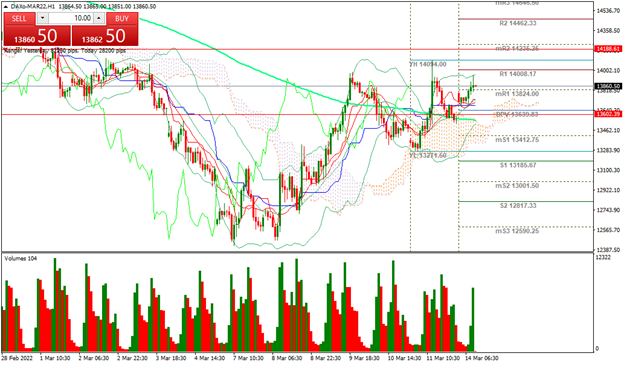 |
| Support 1: 13,779.6 Support 2: 13,735.3 Support 3: 13,674.6 Resistance 1: 13,884.6 Resistance 2: 13,945.3 Resistance 3: 13,989.6 Pivot Point: 13,840.3 |
| The index is at resistance 1, where it has a triple top to overcome before climbing towards resistance 2. Expected trading range between 13,674 and 13,989. Pivot point for trend change at 13,840. RSI approaching the overbought zone. |
| PALLADIUM -6.45% |
| The price of palladium is currently down 6.45% and is trading at USD$2,624 per Troy ounce. The price is correcting as the global supply of palladium is starting to be impacted, as Russia is the producer of 40% of the palladium produced globally. The main uses of palladium are in engine components, investment assets and jewelry. Gold and silver are also correcting, 0.67% and 1.20% respectively. |
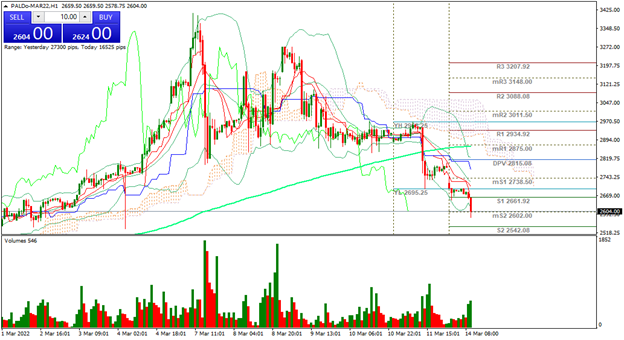 |
| Support 1: 2,658.34 Support 2: 2,639.67 Support 3: 2,619.34 Resistance 1: 2,697.34 Resistance 2: 2,717.67 Resistance 3: 2,736.34 Pivot Point: 2,678.67 |
| The price is below the 200-day moving average. Bearish channel. Expected trading range between USD$2,619 and USD$2,736. Pivot point for trend change at USD$2,678. RSI in oversold zone. |
| ETHEREUM +0.59% |
| Crypto traders are watching the European Parliament’s vote on the regulation of the market. On the other hand, Ethereum founder Vitalik Buterin announced that version 2.0 will not be faster but will reach a massive scale of use. The above has helped the crypto start the week in positive territory. Ethereum is currently up 0.59% and is trading at USD$2,594. Bitcoin is down 0.15% and is trading at USD$39,035. |
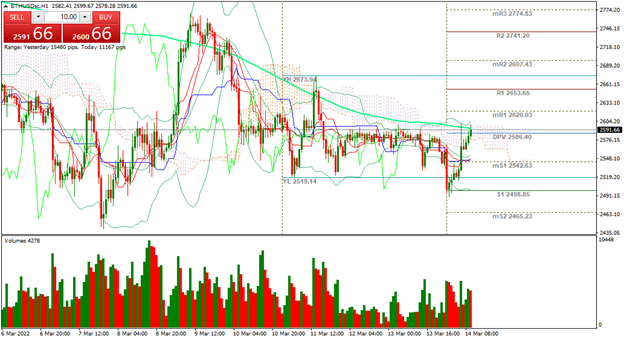 |
| Support 1: 2,576.49 Support 2: 2,566.59 Support 3: 2,558.53 Resistance 1: 2,594.45 Resistance 2: 2,602.51 Resistance 3: 2,612.41 Pivot Point: 2,584.55 |
| The price bounced from the support 1, towards the pivot point, where it could confirm the rise or change the trend again. The crypto comes from a week of sideways movement, so traders could generate a high trading volume at any time. For now, the price is at the same level of the 200-day moving average. RSI neutral. |
| Sources |
| Reuters Market watch Bloomberg Capitalix Market Research |
Risk Disclaimer
Any information/articles/materials/content provided by Capitalix or displayed on its website is intended to be used for educational purposes only and does not constitute investment advice or a consultation on how the client should trade.
Although Capitalix has ensured that the content of such information is accurate, it is not responsible for any omission/error/miscalculation and cannot guarantee the accuracy of any material or any information contained herein.
Therefore, any reliance you place on such material is strictly at your own risk. Please note that the responsibility for using or relying on such material rests with the client and Capitalix accepts no liability for any loss or damage, including without limitation, any loss of profit which may arise directly or indirectly from the use of or reliance on such information.
Risk Warning: Forex/CFDs trading involves significant risk to your invested capital. Please read and make sure that you fully understand our Risk Disclosure Policy.
You should ensure that, depending on your country of residence, you are allowed to trade Capitalix.com products. Please ensure that you are familiar with the company’s risk disclosure.