Daily Review for July 15, 2022
The European stock market is in negative territory, due to the U.S. inflation tailwind, Mario Draghi’s resignation as Italian Prime Minister and the Euro’s parity with the Dollar.
JP Morgan and Morgan Stanley started the corporate results season for Q2 2022, with results below market expectations.
Overall Wall Street stock indices are sideways as investors remain nervous about the future of the economy and the possible recession ahead.
Cryptos reacted positively to the US inflation report. Ethereum is currently up 9.53% and is trading at USD$1,195, while Bitcoin is up 5.32% and is trading at USD$20,688.
| EUROSTOXX 50 -1.85% |
| The European stock market is in negative territory, due to the U.S. inflation tailwind, Mario Draghi’s resignation as Italy’s Prime Minister and the Euro’s parity with the U.S. Dollar. Following Draghi’s resignation, the Milan stock exchange fell 5.09%. The Eurostoxx 50 is correcting 1.85% and is trading at 3,390 points. The global market correction is also occurring due to the poor financial results of US banks and the fear of a global economic recession. |
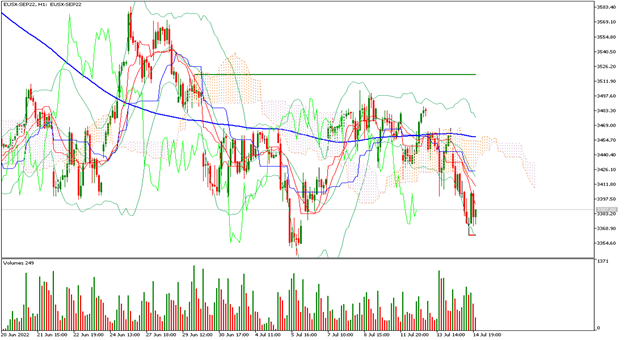 |
| Support 1: 3366 Support 2: 3352 Support 3: 3332 Resistance 1: 3400 Resistance 2: 3420 Resistance 3: 3434 Pivot Point: 3386 |
| The price is below the 200-day moving average, between support 1 and resistance 1. Expected trading range between 3,332 and 3,434. Pivot point for trend change at 3,386. RSI neutral, so the price could continue correcting towards support 1 before changing trend. |
| DOW JONES -0.91% |
| JP Morgan and Morgan Stanley kicked off the corporate earnings season for Q2 2022, with results below market expectations. The companies have expressed the impact on their revenues, due to the decline in demand in the US and the impact on business following the exposure in Russia and Ukraine. Analysts are pricing in a possible 1% interest rate hike by the Fed. The Dow Jones is currently down 0.91% and is trading at 30,511 points. JP Morgan shares are down 3.82%. Morgan Stanley shares are down 0.25% at the moment. |
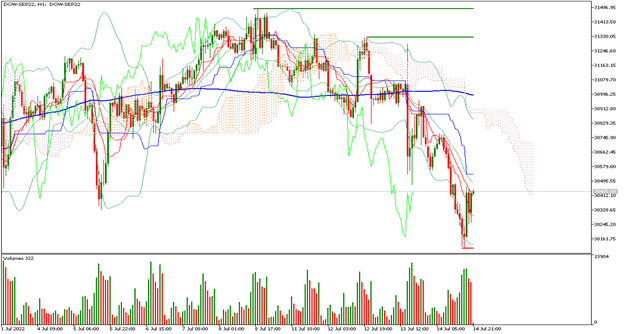 |
| Support 1: 30338.8 Bracket 2: 30223.7 Support 3: 30164.2 Resistance 1: 30513.4 Resistance 2: 30572.9 Resistance 3: 30688.0 Pivot Point: 30398.3 |
| Price is below the 200-day moving average, between support 2 and resistance 1. Expected trading range between 30,164 and 30,688. Pivot point for trend change at 30,398. RSI neutral, so the index could correct some additional points, despite the rebound attempt that is occurring. |
| GOLD -1.57% |
| Wall Street continues to suffer from the impact of the high inflation data in the US. Also, banks that reported results did not exceed market expectations. Wall Street stock indices are generally sideways as investors remain nervous about the future of the economy and the possible recession ahead. Inflation in the US is running at 9.1% year over year, so analysts expect the Fed to hike rates by 1% at its meeting at the end of July 2022. Gold is currently down 1.57% and is trading at USD$1,708 per Troy ounce. |
 |
| Support 1: 1707.94 Support 2: 1706.47 Support 3: 1705.09 Resistance 1: 1710.79 Resistance 2: 1712.17 Resistance 3: 1713.64 Pivot Point: 1709.32 |
| Price is below the 200-day moving average, between support 3 and resistance 1. Expected trading range between USD$1,705 and USD$1,713. Pivot point for trend change at USD$1,709. RSI neutral, so the price could drop some additional points, before gaining interest from traders to hedge portfolios in the face of volatility in equities. |
| ETHEREUM +9.53% |
| Cryptos reacted positively to the US inflation report. At the moment Ethereum is up 9.53% and is trading at USD$1,195, while Bitcoin is up 5.32% and is trading at USD$20,688. At the moment, the two cryptos have presented an interesting rebound. However, analysts continue with the bearish outlook, projecting a price for Bitcoin at USD$10,000. Bulls project that the crypto could rise as high as USD$30,000. With the Bitcoin drop in recent days, Tesla is losing USD$440 million. The company Celsius Network entered bankruptcy protection. |
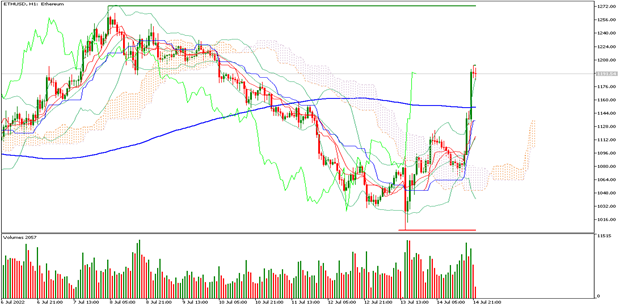 |
| Support 1: 1190.34 Support 2: 1185.12 Support 3: 1179.04 Resistance 1: 1201.64 Resistance 2: 1207.72 Resistance 3: 1212.94 Pivot Point: 1196.42 |
| The price is above the 200-day moving average, which is a bullish signal for Ethereum. Price is between resistance 2 and support 2. Expected trading range between USD$1,179 and USD$1,212. Pivot point for trend change at USD$1,196. RSI in overbought zone, so traders could start taking profits. |
| Sources |
| Reuters Market watch Bloomberg Capitalix Market Research |
Risk Disclaimer
Any information/articles/materials/content provided by Capitalix or displayed on its website is intended to be used for educational purposes only and does not constitute investment advice or a consultation on how the client should trade.
Although Capitalix has ensured that the content of such information is accurate, it is not responsible for any omission/error/miscalculation and cannot guarantee the accuracy of any material or any information contained herein.
Therefore, any reliance you place on such material is strictly at your own risk. Please note that the responsibility for using or relying on such material rests with the client and Capitalix accepts no liability for any loss or damage, including without limitation, any loss of profit which may arise directly or indirectly from the use of or reliance on such information.
Risk Warning: Forex/CFDs trading involves significant risk to your invested capital. Please read and make sure that you fully understand our Risk Disclosure Policy.
You should ensure that, depending on your country of residence, you are allowed to trade Capitalix.com products. Please ensure that you are familiar with the company’s risk disclosure.