Daily review for January 13, 2022
Wall Street indices are mixed at the moment. The Nasdaq 100 is looking for a continuation of the rebound. Indices in Europe are also mixed awaiting the ECB economic bulletin. Mainly on monetary policy and interest rates.
Traders continue to take positions in metals, mainly gold. Corporate earnings season continues in the market.
Cryptos bounce and Bulls look to consolidate the rally. Large investors are re-entering the market.
Winter temperatures continue to drop. This is leading to increased demand for energy commodities. Natural gas prices continue to rally.
| NASDAQ 100 -0.23% |
| The market begins to correct some points, looking for the corrective phase of adjustment or retracement. Buyers or longs in the market began to take positions in the 15,245 point zone. At the moment, Wall Street indexes are in negative territory. Futures in Europe are also correcting. At the moment, traders are waiting for a more pronounced rebound of the indices. They are also watching the corporate earnings season. At the moment, the Nasdaq 100 is down 0.23% and is trading at 15,876 points. |
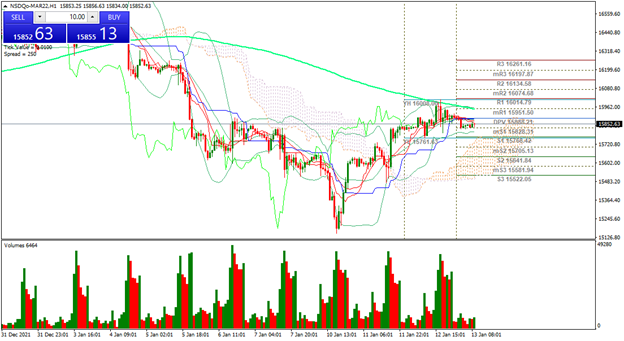 |
| Support 1: 15,846.3 Support 2: 15,826.3 Support 3: 15,808.6 Resistance 1: 15,884.0 Resistance 2: 15,901.7 Resistance 3: 15,921.7 Pivot Point: 15,864.0 |
| The price is at the pivot point, where a trend change could occur. The Bulls are looking to break the 200-day moving average line. Trading range between 15,808 and 15,921. Possible sideways movement before trend confirmation. |
| GOLD -0.10% |
| The price of gold remains at the triple top in the area of USD $1,826. Traders are watching the Producer Price Index and new claims for unemployment benefits in the United States. At the moment, the price of gold is down 0.10% and is trading at USD$1,825 per Troy ounce. Traders are also looking forward to the ECB economic bulletin, which will present the monetary policy statement, taking into account the state of inflation and market recovery. |
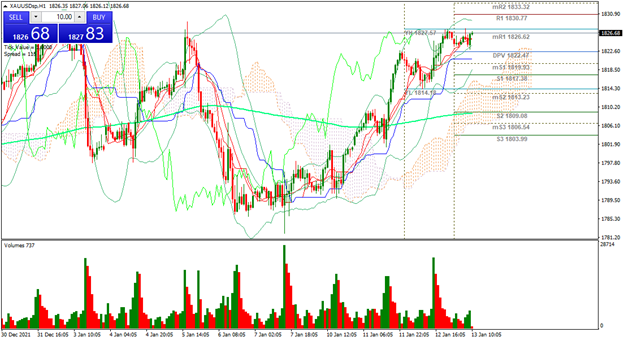 |
| Support 1: 1,824.41 Support 2: 1,822.13 Support 3: 1,820.76 Resistance 1: 1,828.06 Resistance 2: 1,829.43 Resistance 3: 1,831.71 Pivot Point: 1,825.78 |
| Triple top. If the Bulls manage to overcome this zone, the next target level is USD$1,844 per Troy ounce. Expected trading range between USD$1,820 and USD$1,831. Pivot point at USD$1,825. RSI approaching the overbought zone. |
| BITCOIN +3% |
| The company Bitfarms, bought 1,000 Bitcoins at the support level of USD$40,019. This shows that whales and large investors are entering the market again. On the other hand, Jack Dorsey announced the creation of a fund to support Bitcoin miners and developers in legal situations. Meanwhile, Bitcoin is up 3% and is trading at USD$43,812. The Bulls are looking to consolidate the rally, seeking the target of USD$46,361. |
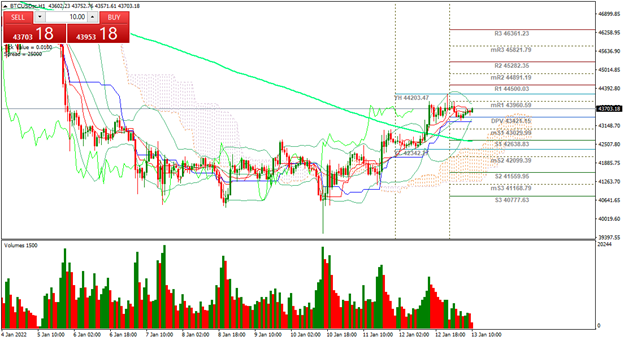 |
| Support 1: 43,614.2 Support 2: 43,519.4 Support 3: 43,441.8 Resistance 1: 43,786.6 Resistance 2: 43,864.2 Resistance 3: 43,959.0 Pivot Point: 43,691.8 |
| Expected trading range between USD$43,441 and USD$43,959. Pivot point for trend change at USD$43,691. RSI approaching the overbought zone. The price broke above the 200-day moving average line, which is a bullish signal for Bitcoin. |
| NATURAL GAS -2.18% |
| The price of natural gas is falling 2.18% and is trading at USD$4.75 per BTU. Goldman Sachs announced a new commodity super cycle, which could last 10 years. Winter in Europe and the Northern Hemisphere continues with falling temperatures. As a result, the demand for commodities in the energy segment continues to increase. Therefore, the rally in Natural Gas is being supported. |
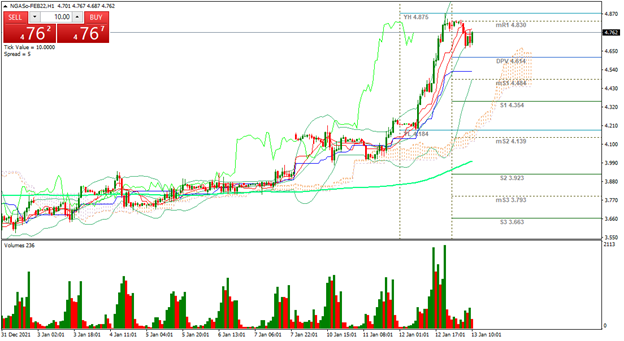 |
| Support 1: 4.656 Support 2: 4.617 Support 3: 4.557 Resistance 1: 4.755 Resistance 2: 4.815 Resistance 3: 4.854 Pivot Point: 4.716 |
| Price is at resistance 1. Expected trading range between USD$4.77 and USD$4.85 per BTU. Pivot point at USD$4.71. RSI leaving the overbought zone. Bulls maintain the next target at USD$5.73 per BTU. The price remains above the 200-day moving average. |
| Sources |
| Reuters Market watch Bloomberg Capitalix Market Research |
Risk Disclaimer
Any information/articles/materials/content provided by Capitalix or displayed on its website is intended to be used for educational purposes only and does not constitute investment advice or a consultation on how the client should trade.
Although Capitalix has ensured that the content of such information is accurate, it is not responsible for any omission/error/miscalculation and cannot guarantee the accuracy of any material or any information contained herein.
Therefore, any reliance you place on such material is strictly at your own risk. Please note that the responsibility for using or relying on such material rests with the client and Capitalix accepts no liability for any loss or damage, including without limitation, any loss of profit which may arise directly or indirectly from the use of or reliance on such information.
Risk Warning: Forex/CFDs trading involves significant risk to your invested capital. Please read and make sure that you fully understand our Risk Disclosure Policy.
You should ensure that, depending on your country of residence, you are allowed to trade Capitalix.com products. Please ensure that you are familiar with the company’s risk disclosure.