Daily review for January 12, 2022
Traders are watching the U.S. inflation data. Depending on the data, the Fed could accelerate the first interest rate hike of the year.
Investors take positions in metals, fixed income, Bitcoin and Ethereum as safe-haven instruments against inflation.
Cryptos rebound; Bitcoin is trading at USD$42,586. Ethereum is trading at USD$3,240. Whales begin to re-enter the market.
Energy markets continue to show rising demand, mainly in European and U.S. markets. Russia cuts natural gas exports to Europe. Meanwhile Saudi Aramco seeks to gain market share.
| GOLD -0.15% |
| Traders are keeping a close eye on the U.S. inflation data. Analysts are expecting at least 0.5% on a monthly basis. In annual terms, 7% cumulative. Gold as a safe haven instrument against inflation is currently down 0.15% and is trading at USD$1,817 per Troy ounce. Traders continue to take positions in silver, fixed income and Bitcoin. The FED is watching the inflation data to make decisions on monetary policy. The data could accelerate the first interest rate hike. |
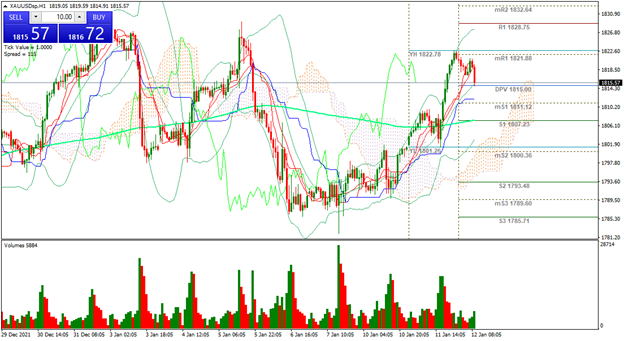 |
| Support 1: 1,814.79 Support 2: 1,812.72 Support 3: 1,809.99 Resistance 1: 1,819.59 Resistance 2: 1,822.32 Resistance 3: 1,824.39 Pivot Point: 1,817.52 |
| The price is at a triple top at resistance 1. If the Bulls manage to overcome this zone, the next target level is USD$1,850 per Troy ounce. Trading range between USD$1,809 and USD$1,824. Pivot point for trend change at USD$1,817. Neutral RSI coming out of the overbought zone. |
| ETHEREUM +3.87% |
| Ethereum price continues the rebound, this time rising 3.87% and trading at USD$3,227. The whales, considered as big investors, have started to enter the market again. Traders continue to take positions in Bitcoin and Ethereum, as alternative instruments to take shelter against inflation. At the moment, crypto miners are in the massive accumulation phase, i.e. they have not yet released large amounts of cryptos to the market. Ethereum’s main support is at USD$2,878. |
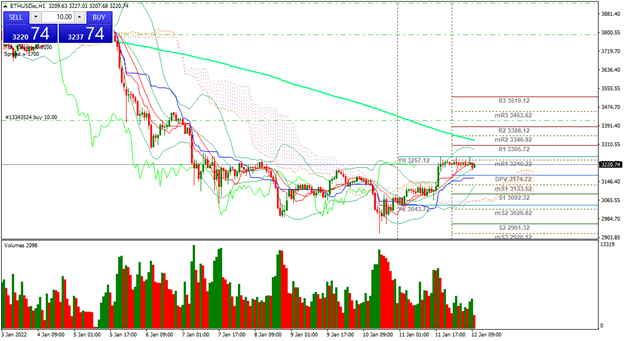 |
| Support 1: 3,204.50 Support 2: 3,191.59 Support 3: 3,174.71 Resistance 1: 3,234.29 Resistance 2: 3,251.17 Resistance 3: 3,264.08 Pivot Point: 3,221.38 |
| Sideways movement above resistance 1. Trading range between USD$3,174 and USD$3,264. Pivot point for trend change at USD$3,221. RSI coming out of the overbought zone. The price is slightly below the 200-day moving average. |
| NATURAL GAS +3.01% |
| The price of natural gas is rebounding 3.01% and is trading at USD$4.37 per BTU. Prices are on the rise, mainly due to the cut in Russian exports to Europe. As temperatures fall, energy demand in Europe and the United States continues to rise. In business moves, Exxon Mobil put 61 natural gas producing wells in the United States up for sale. |
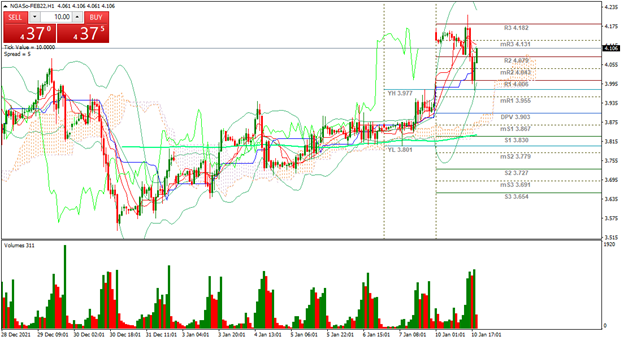 |
| Support 1: 4.229 Support 2: 4.123 Support 3: 4.057 Resistance 1: 4.401 Resistance 2: 4.467 Resistance 3: 4.573 Pivot Point: 4.295 |
| Price is bouncing towards resistance 2. Trading range between USD$4.05 and USD$4.57. Pivot point at USD$4.29. RSI in overbought zone. The price continues above the 200-day moving average. The next target for the Bulls is USD$4.56 per BTU. |
| WTI +0.63% |
| Traders are paying attention to the IEA oil inventories report. Analysts expect the reduction of 1.9 million barrels. In the API report, oil stocks decreased by 1.07 million barrels. On the other hand, gasoline inventories increased. In business moves, Saudi Aramco continues the campaign to win the energy market in Europe. At the moment, the price of WTI is up 0.63% and is trading at USD$81.75 per barrel. |
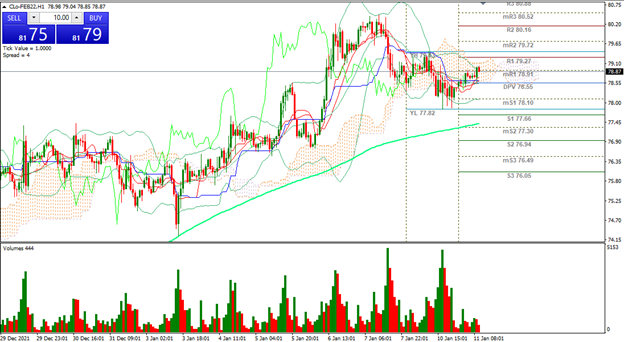 |
| Support 1: 81.20 Support 2: 81.05 Support 3: 80.93 Resistance 1: 81.47 Resistance 2: 81.59 Resistance 3: 81.74 Pivot Point: 81.32 |
| The price remains above the 200-day moving average. WTI is at resistance 1. Expected trading range between USD$80.93 and USD$81.74. Pivot point at USD$81.32. RSI in overbought zone. Possible continuation of the bullish channel. |
| Sources |
| Reuters Market watch Bloomberg Capitalix Market Research |
Risk Disclaimer
Any information/articles/materials/content provided by Capitalix or displayed on its website is intended to be used for educational purposes only and does not constitute investment advice or a consultation on how the client should trade.
Although Capitalix has ensured that the content of such information is accurate, it is not responsible for any omission/error/miscalculation and cannot guarantee the accuracy of any material or any information contained herein.
Therefore, any reliance you place on such material is strictly at your own risk. Please note that the responsibility for using or relying on such material rests with the client and Capitalix accepts no liability for any loss or damage, including without limitation, any loss of profit which may arise directly or indirectly from the use of or reliance on such information.
Risk Warning: Forex/CFDs trading involves significant risk to your invested capital. Please read and make sure that you fully understand our Risk Disclosure Policy.
You should ensure that, depending on your country of residence, you are allowed to trade Capitalix.com products. Please ensure that you are familiar with the company’s risk disclosure.