Daily review for January 11, 2022
The market is attentive to central bankers. The focus is on monetary policy strategy. Goldman Sachs estimates four rate hikes this year. Metals are bullish.
Oil supply is being affected by the Libyan port closures and protests in Afghanistan.
Cryptos are trying to rebound after continued selling. Bulls are trying to regain the USD$43,000 area, in order to climb again towards USD$46,000. Hedge funds have not entered the market at the moment.
Rebound of the Nasdaq 100. The Bulls are looking for the 16,000 level. Traders are watching the monetary policy announcements.
| GOLD +0.52% |
| Traders are looking forward to statements from Fed Chairman Jerome Powell, ECB President Christine Lagarde and Bundesbank President Jens Weidmann. All will talk about monetary policy, interest rate hikes, and inflation containment strategies. At the moment the price of gold is up 0.52% and is trading at USD$1,808 per Troy ounce. Goldman Sachs estimates four interest rate hikes this year. |
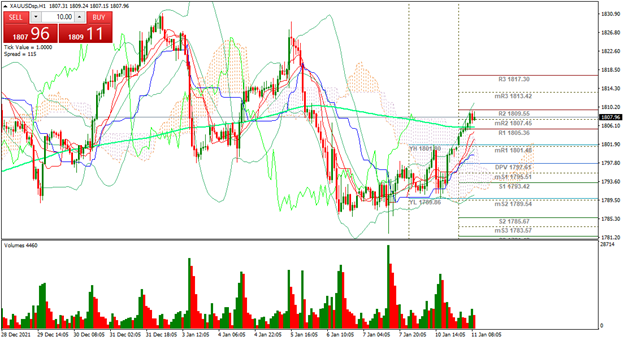 |
| Support 1: 1,806.26 Support 2: 1,804.98 Support 3: 1,803.51 Resistance 1: 1,809.01 Resistance 2: 1,810.48 Resistance 3: 1,811.76 Pivot Point: 1,807.73 |
| The price is at resistance 2. Gold is forming the bullish channel, favorably breaking the 200-day moving average line. Expected trading range between USD$1,803 and USD$1,811. Pivot point for trend change at USD$1.807. RSI in overbought zone. |
| WTI +0.92% |
| WTI price is up 0.92% and is trading at USD$79.02 per barrel. Global supply is being affected by the weather in Libya, where four of the main ports have shut down operations. Likewise, protests in Afghanistan have disrupted the country’s oil production. Brent crude oil is up 0.75% and is trading at USD$81.49 per barrel. Traders are watching the short-term energy report from the EIA. On the demand side, energy consumption in the U.S. and Europe continues to rise. |
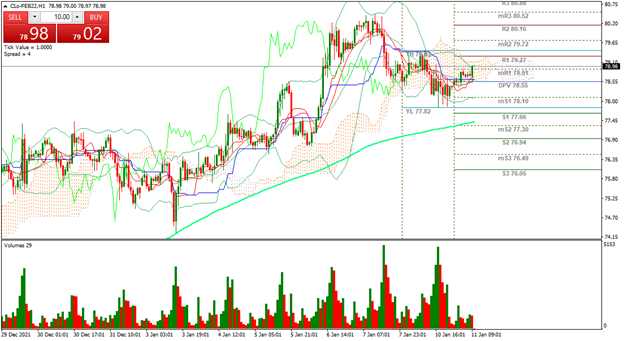 |
| Support 1: 78.68 Support 2: 78.44 Support 3: 78.27 Resistance 1: 79.09 Resistance 2: 79.26 Resistance 3: 79.50 Pivot Point: 78.85 |
| The price is above the 200-day moving average. Sideways movement above resistance 1. Expected trading range between USD$78.27 and USD$79.50. Pivot point for trend change at USD$78.85 per barrel. RSI neutral, so there may be continuity of the uptrend. |
| BITCOIN +0.56% |
| Moving sideways, the Bulls are trying to recover some points. This time Bitcoin price is up 0.56% and trading at USD$42.298. Crypto traders are paying attention to the statements of central bankers. Rising interest rates mean an increase in the cost of money, which increases the cost of investments. For the moment, hedge funds have not entered the market. The ideal support levels are being evaluated. |
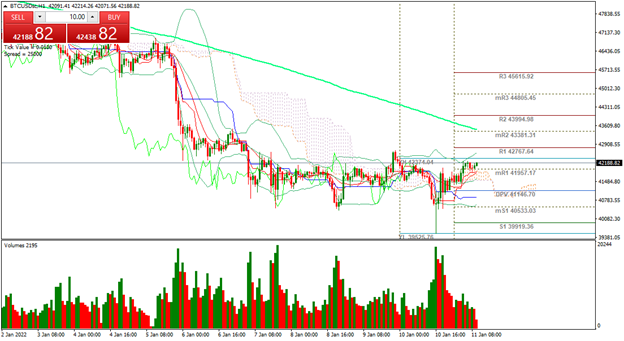 |
| Support 1: 42,122.0 Support 2: 42,024.0 Support 3: 41,950.0 Resistance 1: 42,294.0 Resistance 2: 42,368.0 Resistance 3: 42,466.0 Pivot Point: 42,196.0 |
| The price is below the 200-day moving average. Sideways movement above the resistance zone 1. Expected trading range between USD$41,950 and USD$42,466. Pivot point at USD$42,196. RSI neutral. The Bulls are looking to regain USD$43,000 in order to climb to resistance 3. |
| NASDAQ 100 +0.03% |
| Yesterday the index closed with a slight rise of 0.05%, showing a rebound from the 15,151 zone. Traders expect a possible further rebound, depending on the statements of central bankers. At the moment the index is up 0.03% and is trading at 15,618 points. Traders are starting to increase the volume of buying on the index. New variants of the Covid 19, emerge, so traders know that the shares of technology companies have performed very well during the pandemic. |
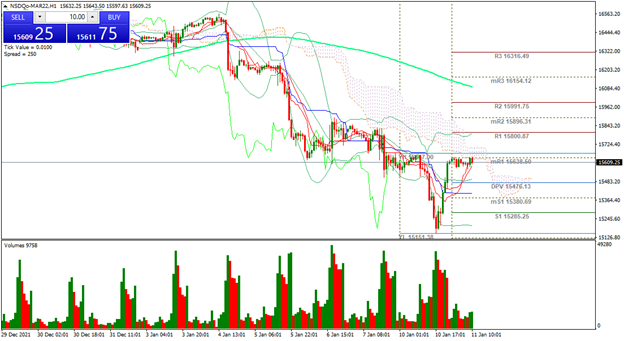 |
| Support 1: 15,609.8 Support 2: 15,570.8 Support 3: 15,549.1 Resistance 1: 15,670.5 Resistance 2: 15,692.2 Resistance 3: 15,731.2 Pivot Point: 15,631.5 |
| Rebound from 15,151 points. Expected trading range between 15,549 and 15,731. Pivot point at 15,631. RSI neutral. The Bulls are looking to break above the 200-day moving average line. If so, target is 16,316. |
| Sources |
| Reuters Market watch Bloomberg Capitalix Market Research |
Risk Disclaimer
Any information/articles/materials/content provided by Capitalix or displayed on its website is intended to be used for educational purposes only and does not constitute investment advice or a consultation on how the client should trade.
Although Capitalix has ensured that the content of such information is accurate, it is not responsible for any omission/error/miscalculation and cannot guarantee the accuracy of any material or any information contained herein.
Therefore, any reliance you place on such material is strictly at your own risk. Please note that the responsibility for using or relying on such material rests with the client and Capitalix accepts no liability for any loss or damage, including without limitation, any loss of profit which may arise directly or indirectly from the use of or reliance on such information.
Risk Warning: Forex/CFDs trading involves significant risk to your invested capital. Please read and make sure that you fully understand our Risk Disclosure Policy.
You should ensure that, depending on your country of residence, you are allowed to trade Capitalix.com products. Please ensure that you are familiar with the company’s risk disclosure.