Daily Review for February 17, 2022
Metals continue to rise as hedge funds and traders hedge portfolios from inflation, rising interest rates and geo-political tensions.
Bitcoin corrects. Funds seek more traditional assets to mitigate market volatility. Gold, Silver and the Swiss Franc enter investors’ portfolios.
Wall Street and European stock indexes are in negative territory. According to analysts, the geo-political tensions have not diminished notably, so there could be greater oscillations in the stock markets in the coming days.
Crude oil inventories decreased by 1.9 million barrels in the United States. Prices are correcting as traders take profits. However, analysts expect a possible price rebound towards USD$98 per barrel.
| GOLD +0.87% |
| The Fed minutes were presented. At the moment, no exact date for the interest rate hike was indicated, however analysts estimate it for the March meeting. Traders maintain their interest in metals due to inflation, rates hike, which is expected to be between five and seven hikes, and geopolitical tensions. At the moment the price of gold is up 0.87% and is trading at USD$1,886 per Troy ounce. Today we will have the ECB economic committee meeting, so gold could generate further upward movement. |
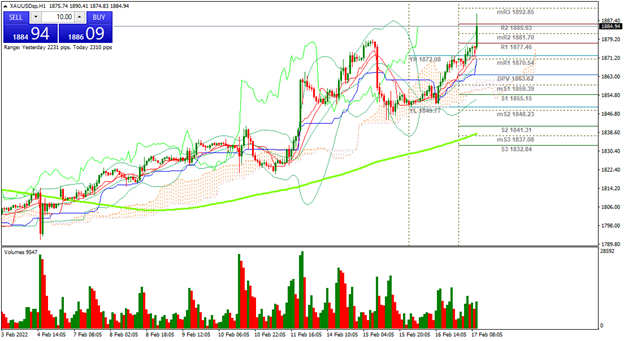 |
| Support 1: 1,876.54 Support 2: 1,874.82 Support 3: 1,873.59 Resistance 1: 1,879.49 Resistance 2: 1,880.72 Resistance 3: 1,882.44 Pivot Point: 1,877.77 |
| The price is above the 200-day moving average. Expected trading range between USD$1,873 and USD$1,882. Pivot point for trend change at USD$1,877. RSI in overbought zone, which explains the profit taking at resistance 3. |
| BITCOIN -1.61% |
| Sideways movement of the Bitcoin price. After the geo-political tensions, some hedge funds have opted to liquidate positions and take hedge in more traditional assets such as gold and the Swiss Franc. Bitcoin is currently down 1.61% and is trading at USD$43,330, while Ethereum is down 2.54% and is trading at USD$3,058. On the other hand, Twitter has added the Ethereum tipping function to its platform, which is showing more and more progress towards the acceptance of crypto as a means of payment on different platforms. |
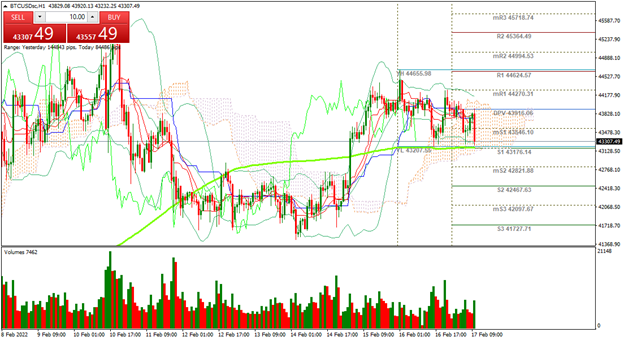 |
| Support 1: 43,838.4 Support 2: 43,729.7 Support 3: 43,667.4 Resistance 1: 44,009.4 Resistance 2: 44,071.7 Resistance 3: 44,180.4 Pivot Point: 43,900.7 |
| The price is slightly above the 200-day moving average. Bulls should keep the price above this level, for the price to remain in an uptrend. Expected trading range between USD$43,667 and USD$44,180. Pivot point at USD$43,900. RSI neutral. |
| DOW JONES -0.58% |
| Wall Street indexes are correcting at the moment. The Dow Jones is showing a drop of 200 points. The S&P500 is down 0.56% and the Nasdaq 100 is down 0.63%. European stock indexes are also in negative territory, with the main declines in Italy’s MIB (-0.54%). The market is also punishing Russia’s RTS stock index which is down 4.76%. Traders are watching for comments from FOMC members on the FED minutes. |
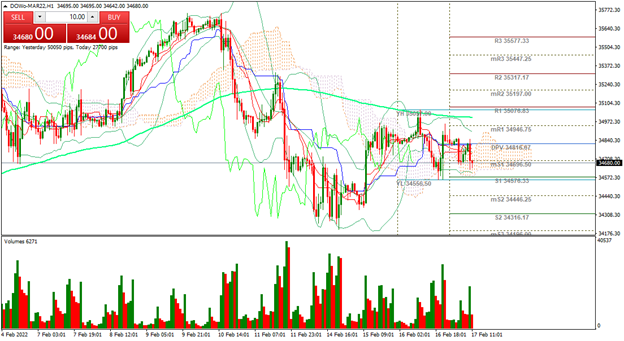 |
| Support 1: 34,661.8 Support 2: 34,576.5 Support 3: 34,447.8 Resistance 1: 34,875.8 Resistance 2: 35,004.5 Resistance 3: 35,089.8 Pivot Point: 34,790.5 |
| The index is below the 200-day moving average. Expected trading range between 34,447 and 35,089. Pivot point for trend change at 34,790. RSI neutral. Possible sideways movement before the market changes trend. It all depends on fundamental events. |
| WTI -1.30% |
| U.S. shale gas production continues to increase. Weekly US crude inventories decreased by 1.9 million barrels. Gasoline prices hit record highs in California. Iran seeks to return to the international market. Europe continues to be the main market for US LNG. At this moment, the price of WTI is falling 1.30% and is trading at USD$92.56 per barrel. Brent is falling 1.10% and is trading at USD$93.78 per barrel. |
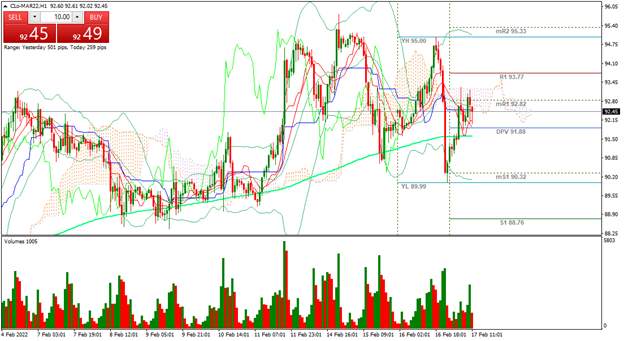 |
| Support 1: 92.16 Support 2: 91.63 Support 3: 91.13 Resistance 1: 93.19 Resistance 2: 93.69 Resistance 3: 94.22 Pivot Point: 92.66 |
| The price is above the 200-day moving average. WTI is at resistance 1, so a profit taking is taking place. Bulls are looking to bounce from this level to have continuity towards USD$98.78 equivalent to resistance 3. Pivot point at USD$92.66. RSI neutral. |
| Sources |
| Reuters Market watch Bloomberg Capitalix Market Research |
Risk Disclaimer
Any information/articles/materials/content provided by Capitalix or displayed on its website is intended to be used for educational purposes only and does not constitute investment advice or a consultation on how the client should trade.
Although Capitalix has ensured that the content of such information is accurate, it is not responsible for any omission/error/miscalculation and cannot guarantee the accuracy of any material or any information contained herein.
Therefore, any reliance you place on such material is strictly at your own risk. Please note that the responsibility for using or relying on such material rests with the client and Capitalix accepts no liability for any loss or damage, including without limitation, any loss of profit which may arise directly or indirectly from the use of or reliance on such information.
Risk Warning: Forex/CFDs trading involves significant risk to your invested capital. Please read and make sure that you fully understand our Risk Disclosure Policy.
You should ensure that, depending on your country of residence, you are allowed to trade Capitalix.com products. Please ensure that you are familiar with the company’s risk disclosure.