Daily Review for February 16, 2022
Commodities are in an uptrend, mainly with movement in Natural Gas, metals, energy and agri commodities.
WTI rises 1.13%, driven by the increase in US exports to Europe, and by the decrease in inventories.
Stock indexes rebound globally, boosted by declines amid geo-political tensions.
The RTS of the Russian stock exchange is up 7.37%.
The price of Natural Gas continues to rise. Demand for the commodity in Europe continues increasing.
| GOLD +0.09% |
| Traders are looking forward to the FED minutes, where important points on monetary policy and interest rates will be known. Analysts are holding out the prospect of a rate hike for the March 2022 meeting. On the other hand, geo-political tensions between Ukraine and Russia have started to ease. Investors took profits when gold reached USD$1,876 per ounce. At the moment the price is up 0.09% and is trading at USD$1,858. Traders continue to buy the metal in order to hedge their portfolios against inflation and market volatility. |
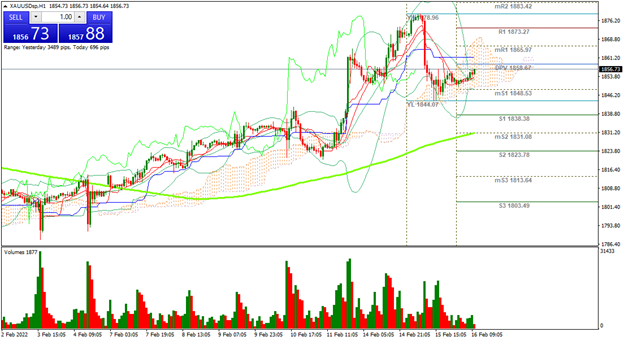 |
| Support 1: 1,855.30 Support 2: 1,854.15 Support 3: 1,852.85 Resistance 1: 1,857.75 Resistance 2: 1,859.05 Resistance 3: 1,860.20 Pivot Point: 1,856.60 |
| The price of gold is above the 200-day moving average. At the moment the metal is at the pivot point, so it could present or confirm a change of trend. Expected trading range between USD$1,852 and USD$1,860. RSI neutral. |
| WTI +1.13% |
| Crude oil inventories in the United States continue to decline, as exports to Europe increase, and domestic demand continues to rise. At the moment, the price of WTI is up 1.13% and is trading at USD$93.06 per barrel. Analysts estimate a reduction of 1.5 million barrels of crude oil. The main Oil & Gas companies think that prices could remain at the current level for a longer term. Brent crude oil is trading at USD$94.41 per barrel. |
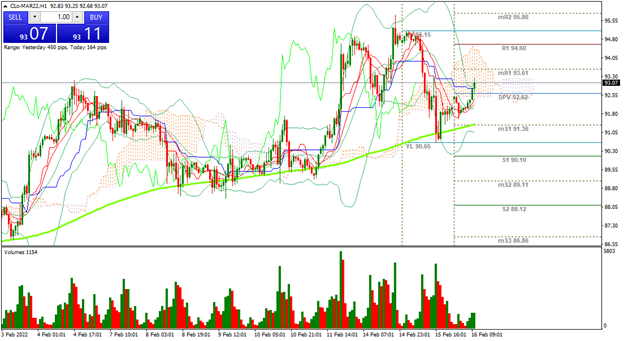 |
| Support 1: 92.46 Support 2: 92.23 Support 3: 92.09 Resistance 1: 92.83 Resistance 2: 92.97 Resistance 3: 93.20 Pivot Point: 92.60 |
| The price continues above the 200-day moving average. WTI is approaching resistance 1, where traders continue with bullish volume, in order to reach USD$94.60 per barrel. Pivot point at USD$92.60. RSI neutral. |
| NASDAQ 100 +0.06% |
| Global stock indices continue to rebound after the easing of geo-political tensions. The Nasdaq 100 is currently up 0.06% and is trading at 14,628 points. The corporate earnings season continues. Today it is the turn of Nvidia, Cisco and Shopify among others. As for the stock indexes, at the moment, the Russian RTS, is presenting the highest bullish level with 7.37%. The TecDAX, which refers to technology companies listed in Germany, is up 1.76%. |
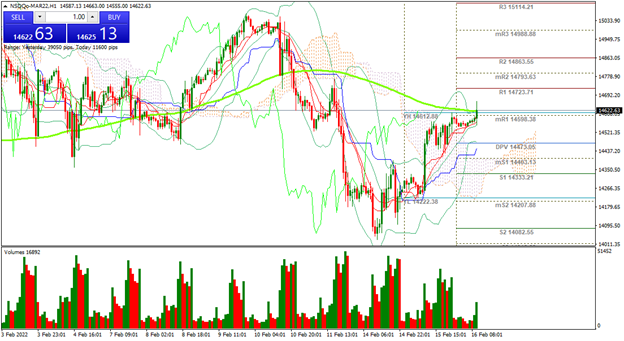 |
| Support 1: 14,577.7 Support 2: 14,564.5 Support 3: 14,552.2 Resistance 1: 14,603.2 Resistance 2: 14,615.5 Resistance 3: 14,628.7 Pivot Point: 14,590.0 |
| The price is at resistance 1, where it is at the same level of the 200-day moving average line. Expected trading range between 14,552 and 14,628. Pivot point at 14,590. RSI neutral, approaching the overbought zone. |
| NATURAL GAS +3.92% |
| Despite the easing of geo-political tensions, the price of Natural Gas continues to rise, mainly driven by demand for the commodity in Europe. Natural Gas is currently up 3.92% and is trading at USD$4.46 per BTU. On the other hand, BHP and Glencore are going to distribute the equivalent of USD$11 billion to their investors, a dividend generated after the commodities rally. Traders also continue to pay attention to the development of the geo-political situation after a pause in tensions. |
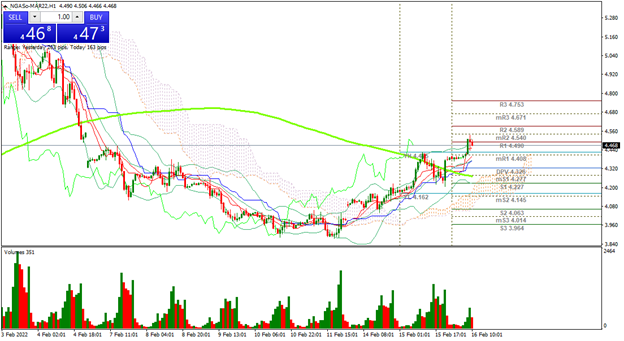 |
| Support 1: 4.442 Support 2: 4.392 Support 3: 4.346 Resistance 1: 4.538 Resistance 2: 4.584 Resistance 3: 4.634 Pivot Point: 4.488 |
| The price crossed the 200-day moving average line. Expected trading range between USD$4.34 and USD$4.63. Pivot point for trend change at USD$4.48 per BTU. RSI in overbought zone. Possible sideways movement above resistance 1. |
| Sources |
| Reuters Market watch Bloomberg Capitalix Market Research |
Risk Disclaimer
Any information/articles/materials/content provided by Capitalix or displayed on its website is intended to be used for educational purposes only and does not constitute investment advice or a consultation on how the client should trade.
Although Capitalix has ensured that the content of such information is accurate, it is not responsible for any omission/error/miscalculation and cannot guarantee the accuracy of any material or any information contained herein.
Therefore, any reliance you place on such material is strictly at your own risk. Please note that the responsibility for using or relying on such material rests with the client and Capitalix accepts no liability for any loss or damage, including without limitation, any loss of profit which may arise directly or indirectly from the use of or reliance on such information.
Risk Warning: Forex/CFDs trading involves significant risk to your invested capital. Please read and make sure that you fully understand our Risk Disclosure Policy.
You should ensure that, depending on your country of residence, you are allowed to trade Capitalix.com products. Please ensure that you are familiar with the company’s risk disclosure.