Daily Review for February 10, 2022
The market is paying close attention to the inflation data for the United States. It is expected to be 7.3% for the month of January 2022. Gold and metals prices are trending sideways.
European stock indices are in positive territory. Switzerland’s SMI shows a significant upward movement as it is considered a safe-haven asset against inflation.
Cryptos keep rallying. Black Rock, as the world’s largest investment fund, started to offer Bitcoin trading to its clients.
Traders are watching the trend change of Natural Gas, depending on the development of geopolitical tensions. In the scenario of armed conflict, JP Morgan projects the price of oil at USD$120 per barrel.
| GOLD -0.16% |
| Traders are keeping an eye on inflation in the United States. Analysts expect a CPI of 7.3% for the month of January 2022. At the moment, gold, as a safe haven against inflation, is moving sideways above USD$1,833 per Troy ounce. If inflation is higher than expected, the price of gold and metals could show a significant upward movement. Otherwise, if the CPI is better than expected, gold and metals prices could correct to the next support level. |
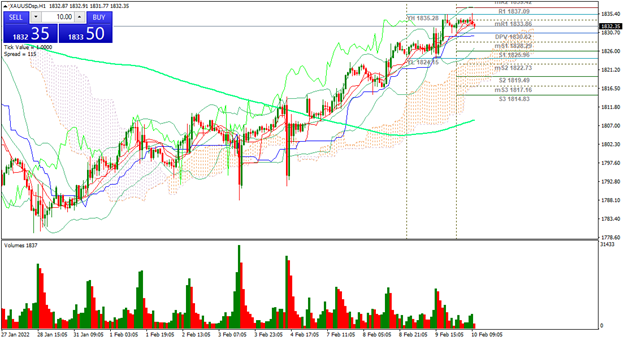 |
| Support 1: 1,834.74 Support 2: 1,833.72 Support 3: 1,832.59 Resistance 1: 1,836.89 Resistance 2: 1,838.02 Resistance 3: 1,839.04 Pivot Point: 1,835.87 |
| The gold price is above the 200-day moving average. It is currently between resistance 1 and the pivot point. Expected trading range between USD$1,832 and USD$1,839. Pivot point for trend change at USD$1,835. RSI neutral. |
| DAX 40 +0.01% |
| Traders are paying attention to the economic forecasts of the European Union and the statements of Luis de Guindos as Vice President of the ECB, where issues related to inflation in the European Union and the bank’s strategies in the face of tapering are expected. At the moment, European stock indices are in positive territory, with main upward movements in the Swiss SMI with +1.61%. For its part, the DAX 40 is moving sideways. |
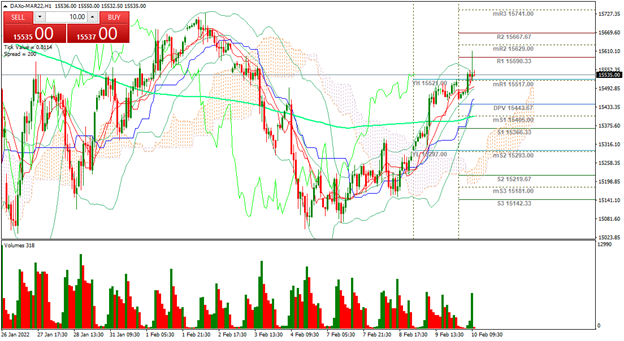 |
| Support 1: 15,523.1 Support 2: 15,499.8 Support 3: 15,487.1 Resistance 1: 15,559.1 Resistance 2: 15,571.8 Resistance 3: 15,595.1 Pivot Point: 15,535.8 |
| The index is at resistance 1, above the line of the 200-day moving average. Expected trading range between 15,487 and 15,595. Pivot point for trend change at 15,535. RSI in overbought zone. Possible correction towards support 1, and then change trend. |
| ETHEREUM +3.30% |
| Analysts expect the cryptocurrency rally to continue during the first half of the year. Projections for July point to a target price of USD$4,000. Ethereum is currently up 3.30% and is trading at USD$3,198. The rally is supported by increased demand from large investors and institutions such as KPMG, the acceptance of the Central Bank of Russia and the announcement of Black Rock as the world’s largest investment fund, to offer Bitcoin trading to its clients. |
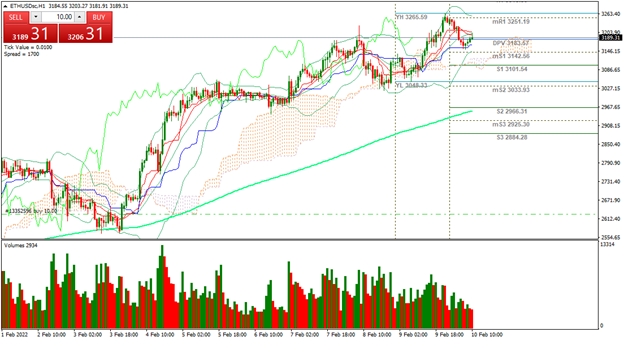 |
| Support 1: 3,181.11 Support 2: 3,171.99 Support 3: 3,166.00 Resistance 1: 3,196.22 Resistance 2: 3,202.21 Resistance 3: 3,211.33 Pivot Point: 3,187.10 |
| The price is above the 200-day moving average, which is a bullish signal for Ethereum. Confirmation of the bullish channel. Expected trading range between UDS$3,166 and USD$3,211. Pivot point at USD$3,187. Neutral RSI. The next Bulls target is at USD$3,536. |
| NATURAL GAS -0.40% |
| According to JP Morgan, if there is a military conflict between Russia and Ukraine, the price of oil could reach $120 per barrel. In the United States, the Democrats are seeking to suspend the natural gas tax at least until the end of 2022, in order to balance the domestic price. At the moment the price of natural gas is falling 0.40% and is trading at USD$4.00 per BTU. WTI is trading at USD$89.97 and Brent at USD$91.74 per barrel. |
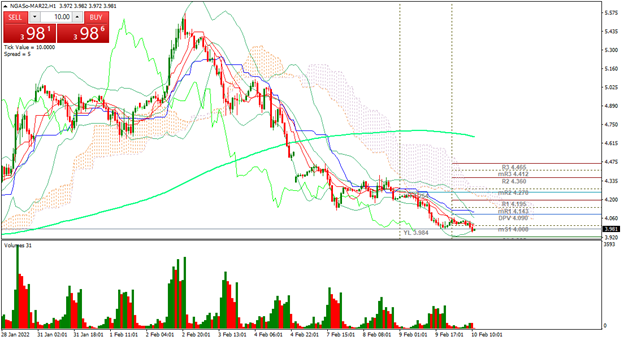 |
| Support 1: 3.946 Support 2: 3.930 Support 3: 3.899 Resistance 1: 3.993 Resistance 2: 4.024 Resistance 3: 4.040 Pivot Point: 3.977 |
| The price is below the 200-day moving average. Expected trading range between USD$3.89 and USD$4.04. Pivot point for trend change at USD$3.97. Neutral RSI coming out of the oversold zone. Traders are watching the trend change, depending on the development of geopolitical tensions. |
| Sources |
| Reuters Market watch Bloomberg Capitalix Market Research |
Risk Disclaimer
Any information/articles/materials/content provided by Capitalix or displayed on its website is intended to be used for educational purposes only and does not constitute investment advice or a consultation on how the client should trade.
Although Capitalix has ensured that the content of such information is accurate, it is not responsible for any omission/error/miscalculation and cannot guarantee the accuracy of any material or any information contained herein.
Therefore, any reliance you place on such material is strictly at your own risk. Please note that the responsibility for using or relying on such material rests with the client and Capitalix accepts no liability for any loss or damage, including without limitation, any loss of profit which may arise directly or indirectly from the use of or reliance on such information.
Risk Warning: Forex/CFDs trading involves significant risk to your invested capital. Please read and make sure that you fully understand our Risk Disclosure Policy.
You should ensure that, depending on your country of residence, you are allowed to trade Capitalix.com products. Please ensure that you are familiar with the company’s risk disclosure.