Daily Review for April 12, 2022
Bitcoin is at the lows of 2022. Traders are watching for a possible trend reversal. Rising bond yields have led to a massive sell-off in equities. The correlation of cryptos with technology companies caused the correction. The market is watching inflation in the US.
WTI is rebounding after the fall towards USD$94 per barrel. Analysts expect a rebound driven by increased demand for crude oil in the European Union and the OPEC report.
Traders are watching the performance of the German economy. Inflation in the country for March 2022 was 2.5%.
The price of Natural Gas has reached the highest price in the last 13 years.
| BITCOIN -5.44% |
| Bitcoin corrected more than 5% and is at the lowest level in 2022. Bitcoin’s high correlation with tech companies, and investors’ fear of the Fed raising interest rates at a faster pace than expected, makes the market feel sideways with negative outlook. However, today we will have the U.S. inflation announcement, which could generate a rebound in crypto in case inflation is higher than expected. Analysts expect 8.4% annually. Bitcoin is currently trading at USD$40,036. |
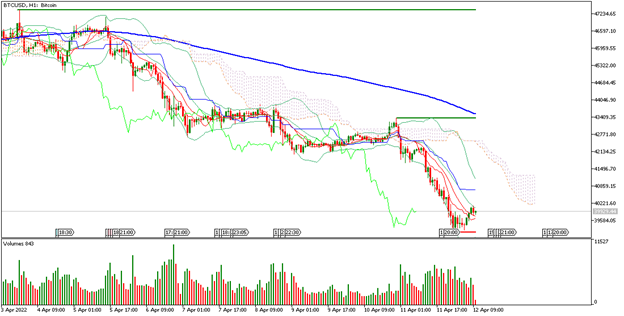 |
| Support 1: 39,818.4 Support 2: 39,679.7 Support 3: 39,493.4 Resistance 1: 40,143.4 Resistance 2: 40,329.7 Resistance 3: 40,468.4 Pivot Point: 40,004.7 |
| The price is trying to bounce from the support 2. However, it is still below the 200-day moving average, which is a bearish signal for Bitcoin. Expected trading range between USD$39,493 and USD$40,468. Pivot point at USD$40,004. Neutral RSI, which could present a sideways trend or an additional correction. |
| WTI +2.55% |
| Traders are watching the OPEC report, which will present the analysis of the different scenarios. According to OPEC, it is impossible for the European Union to completely replace Russian oil. On the other hand, India has closed supply deals with Russia. WTI is currently up 2.55% and is trading at USD$96.75 per barrel. On the other hand, the United States and the United Kingdom continue their strategy to increase the strategic crude oil reserves in the market. |
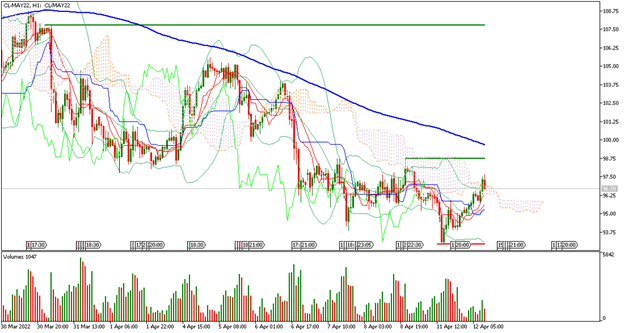 |
| Support 1: 96.58 Support 2: 95.86 Support 3: 95.39 Resistance 1: 97.77 Resistance 2: 98.24 Resistance 3: 98.96 Pivot Point: 97.05 |
| The price is below the 200-day moving average. Crude oil is currently approaching resistance 1. Possible rebound towards USD$103.50. Expected trading range between USD$95.39 and USD$98.96. Pivot point at USD$97.05. RSI near the overbought zone. |
| DAX 40 -1.83% |
| Traders are keeping an eye on German inflation, where analysts expected 2.5% monthly, which met expectations. Inflation in Germany and the European Union continues to be higher than expected. The German and EU inflation target is 2% per year. Therefore, the European Central Bank could raise interest rates at any time. The DAX 40 is currently down 1.83% and is trading at 13,980 points. |
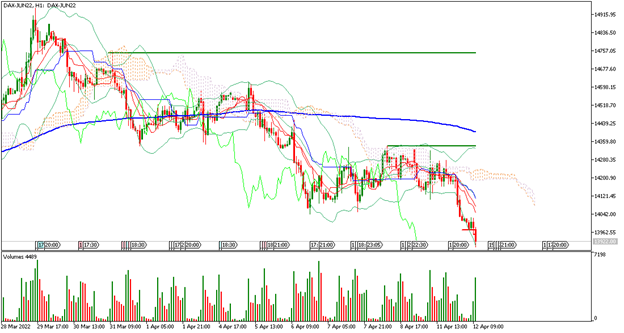 |
| Support 1: 13,948.6 Support 2: 13,916.8 Support 3: 13,878.1 Resistance 1: 14,019.1 Resistance 2: 14,057.8 Resistance 3: 14,089.6 Pivot Point: 13,987.3 |
| The price is at support 2. Expected trading range between 13,878 and 14,089. Pivot point for trend change at 13,987. RSI in oversold zone, which could lead to a change of trend of the index. |
| NATURAL GAS +1.67% |
| The price of natural gas is up 1.67% at the moment and is trading at USD$6.74 per BTU, which indicates that it is at the highest level in the last 13 years. Demand for the commodity from the European Union continues to rise. Member states continue to look for new sources. These include the United States and Africa. Traders continue to see upward movement in the price of the commodity. |
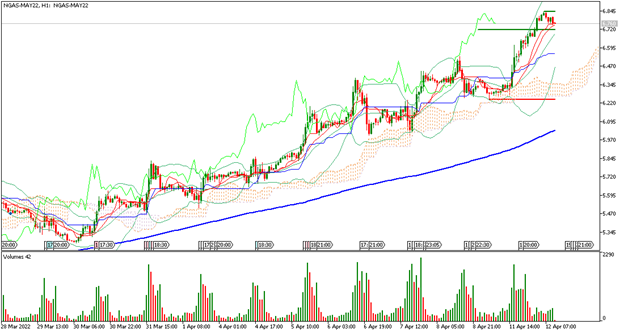 |
| Support 1: 6.742 Support 2: 6.720 Support 3: 6.688 Resistance 1: 6.796 Resistance 2: 6.828 Resistance 3: 6.850 Pivot Point: 6.774 |
| The price is above the 200-day moving average. Expected trading range between USD$6.68 and USD$6.85. Pivot point for trend change at USD$6.77. RSI in overbought zone, so it may present a correction. |
| Sources |
| Reuters Market watch Bloomberg Capitalix Market Research |
Risk Disclaimer
Any information/articles/materials/content provided by Capitalix or displayed on its website is intended to be used for educational purposes only and does not constitute investment advice or a consultation on how the client should trade.
Although Capitalix has ensured that the content of such information is accurate, it is not responsible for any omission/error/miscalculation and cannot guarantee the accuracy of any material or any information contained herein.
Therefore, any reliance you place on such material is strictly at your own risk. Please note that the responsibility for using or relying on such material rests with the client and Capitalix accepts no liability for any loss or damage, including without limitation, any loss of profit which may arise directly or indirectly from the use of or reliance on such information.
Risk Warning: Forex/CFDs trading involves significant risk to your invested capital. Please read and make sure that you fully understand our Risk Disclosure Policy.
You should ensure that, depending on your country of residence, you are allowed to trade Capitalix.com products. Please ensure that you are familiar with the company’s risk disclosure.