
Bridging the gap between You and the CFD Markets
Our customized solutions and personal support will offer you the confidence needed to start investing in CFDs right away
- Low spreads from 0.5 pips
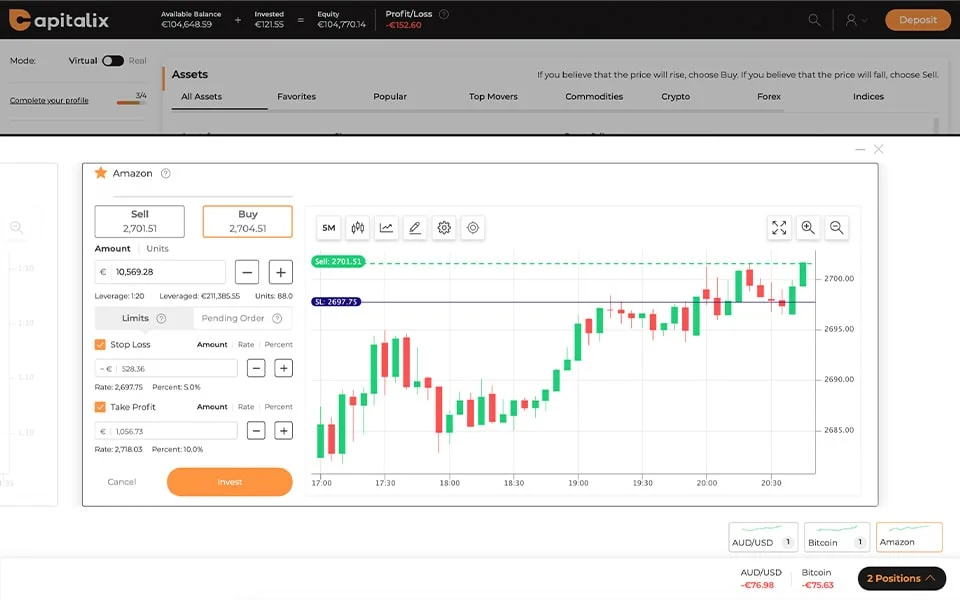
- Leverage up to 1:200
- No trading commissions

Simple but powerful tools for CFD trading
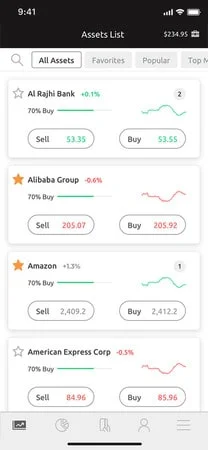
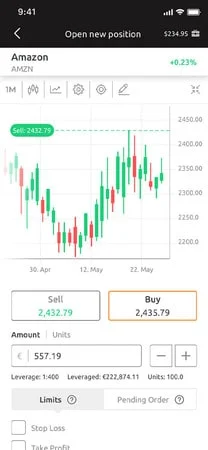
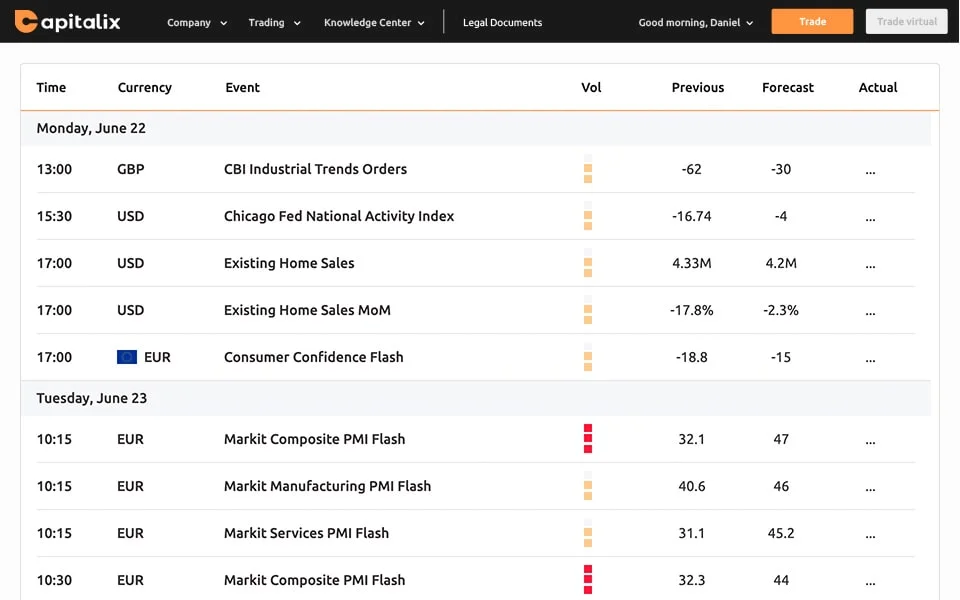
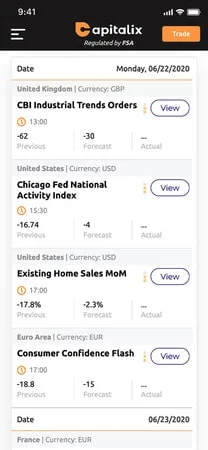
Available on all platforms
Excellent Trading Conditions
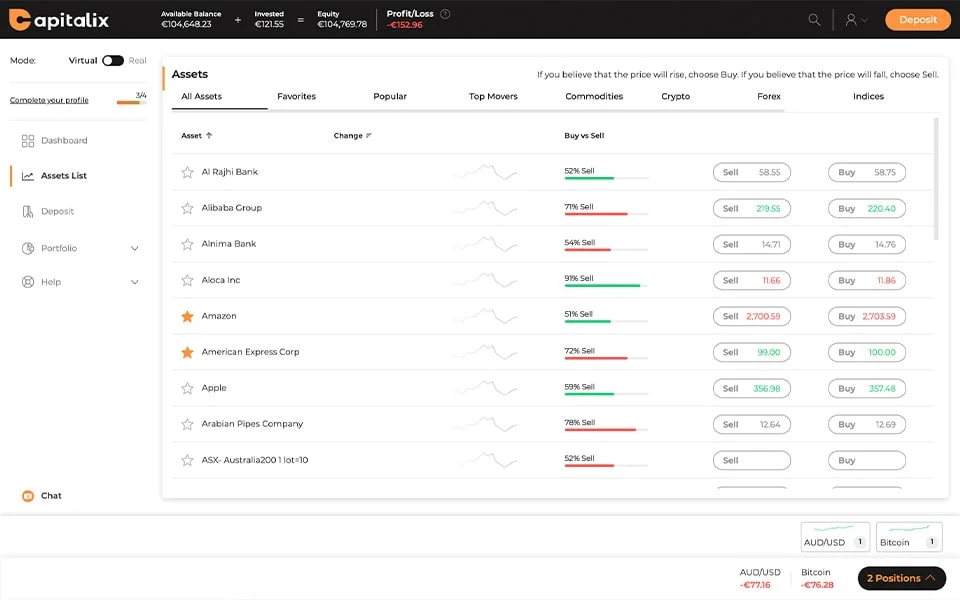
Discover our 300+ CFDs assets and trade your favorite
Our easy-to-use trading platform gives you access to all CFD assets classes from a single account. CFDs on Facebook, Gold, EURUSD, S&P 500, just to name a few, are at your fingertips. *Data provided below in the charts is based on the Capitalix users’ daily activity.
- Popular CFDs
- Top Movers CFDs
- Forex CFDs
- Cryptocurrencies CFDs
- Stocks CFDs
- Indices CFDs
- Commodities CFDs
- Metals CFDs


Personal and customized Live Customer Support
We’re always there – our multilingual support team is dedicated to providing you with an exceptional level of service.
-
Email us at: [email protected]
- Chat with us Customers service chat
Investor interest, efficiency and safety are our top priorities
Our regulation provide a safe, secure, and protected environment for you and your CFD trades.

Regulation
We are a trustworthy and reliable broker regulated by FSA.
Secured Technology
Your financial transactions are protected by industry-leading security protocols.